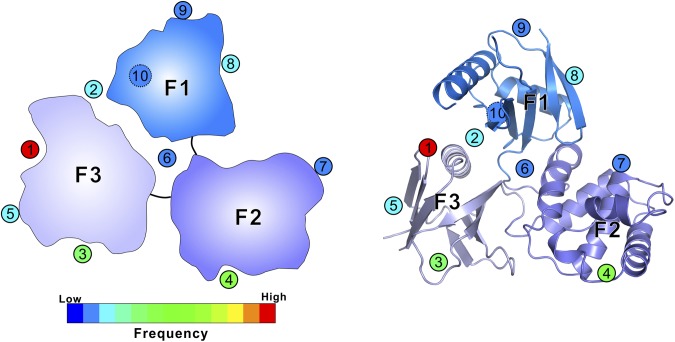
Fig. S5.
Summary of the binding sites used by FERM domains to recognize targets as seen in complex structures. Schematic cartoon (Left) and ribbon diagrams (Right) of the FERM domain of Myo7b CMF are used to illustrate target binding sites of FERM domains. The 10 different sites are shown with numbers in circles. The dashed circle (site 10) indicates that the binding site is located at the back side of the F1 lobe. The circles are filled with color showing the frequencies seen in the crystal structures of FERM domains with their different targets as detailed in Table S1.

