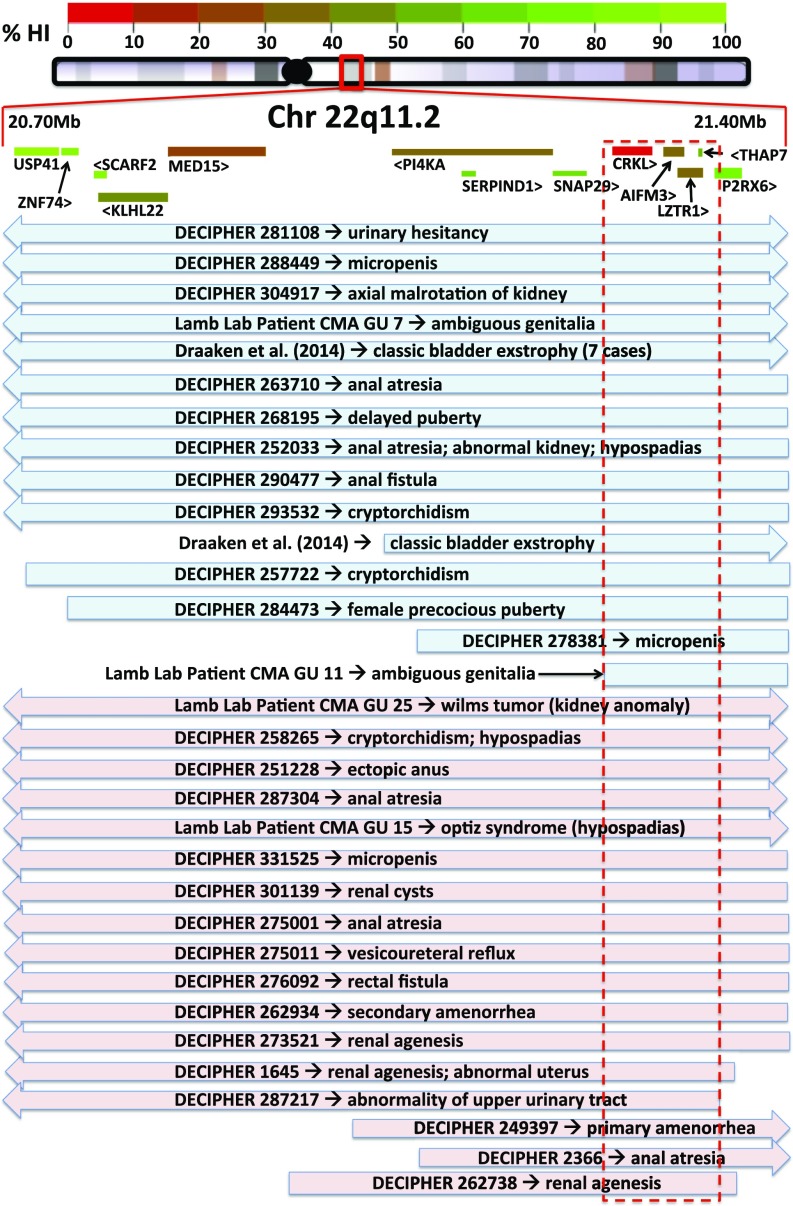
Fig. 1.
Map of GU abnormal patients with CNVs covering 22q11.2 indicates CRKL as candidate gene. CRKL is within the minimal region of overlap and harbors the highest pLI score (pLI = 0.16). Data are gleaned from DECIPHER database, literature (18), as well as original data from D.J.L.’s laboratory (14). Blue indicates duplication; pink indicates deletion. Arrows indicate CNV expands beyond map. Red dotted box indicates minimal region of maximum CNV overlap.

