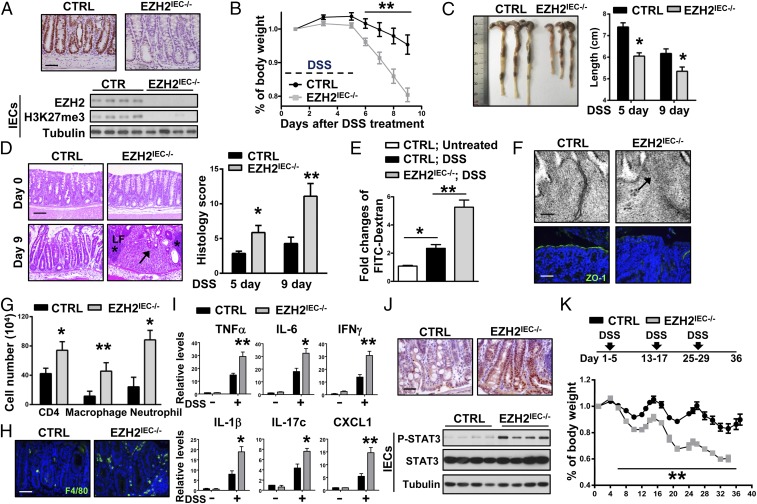
Fig. 2.
Loss of EZH2 in IECs aggravates DSS-induced colitis in mice. (A) Immunohistochemical (Upper) and immunoblot (Lower) analyses of EZH2 expression. (B) Wild-type control (CTRL) and EZH2IEC−/− mice were fed 3% DSS in drinking water for 5 d, and body weights were scored daily (n >9 per group). (C) The mice were euthanized on days 5 and 9 to measure colon length. (D, Left) H&E- stained sections of middle-distal colon tissue collected at days 0 and 9. (D, Right) Semiquantitative scoring of the histopathology. Asterisks denote isolated lymphoid follicles; arrows, infiltration of immune cell and epithelial cell damage (n > 5 per group). (E) Intestinal permeability measured by the concentration of FITC-dextran in the blood serum (n > 5). (F) Representative electron microscope images (Upper) and ZO-1 staining (Lower) in colon sections of mice treated with DSS for 5 d. (G) After 5 d of DSS treatment, colonic lamina propria cells were analyzed by flow cytometry for CD4+ T cells, CD11b+; F4/80+ macrophages, and CD11b+; Gr-1+ neutrophils (n = 3). (H) F4/80 staining in a noninflamed portion of the colon at day 5 of DSS treatment. (I) qRT-PCR analysis of whole colon homogenates to assess cytokine and chemokine production (5 d of DSS treatment; n = 5). (J) STAT3 phosphorylation on Tyr705 in representative colon sections (Upper) and Western blot analysis of colon tissues (Lower), as indicated. (K) Body weight changes in the mice during three cycles of 3% DSS treatment. *P < 0.05; **P < 0.01. (Scale bars: 50 μm in A, F, Lower, H, and J; 100 μm in D; 100 nm in F, Upper.)

