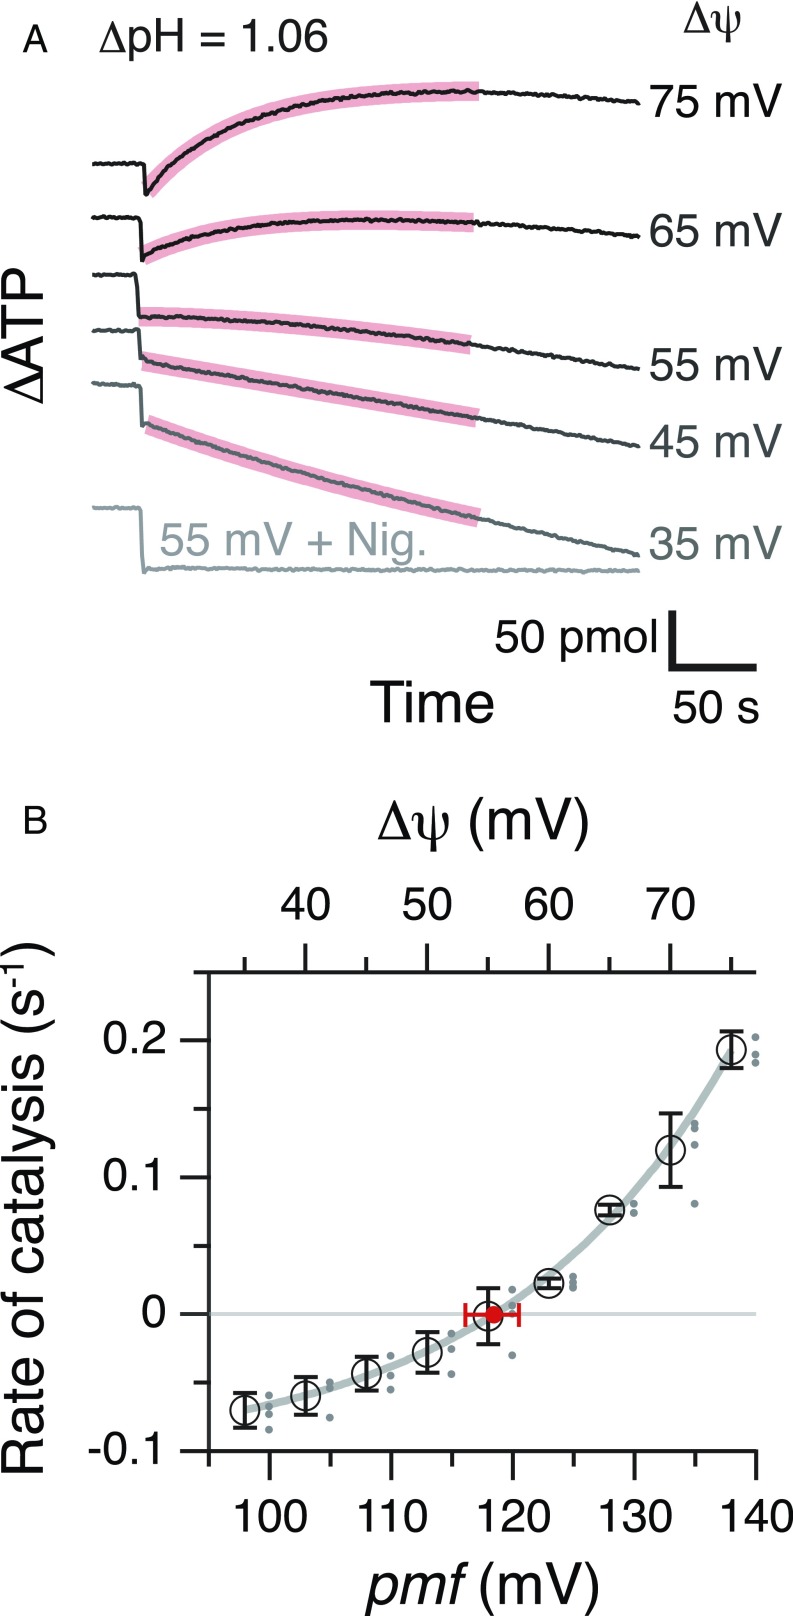
Fig. 1.
ATP synthesis/hydrolysis at different pmf and determination of pmfeq. (A) Typical time courses of ATP synthesis/hydrolysis at different pmf. Reaction was started by the injection of acidified PLs into the base medium containing luciferin/luciferase at t = 0. Vertical axis shows the amount of ATP in the reaction mixture quantified from the intensity of the luciferin luminescence. K(ATP) is 0.64; [ADP] = 80 μM, [Pi] = 10 mM, and [ATP] = 512 nM. ΔpH was 1.06 (pHout 8.04 − pHin 6.98), and Δψ was varied ([K+]in = 5 mM; [K+]out = 20–93 mM), giving 95 mV to 135 mV of pmf. Nigericine (500 nM) was added at Δψ of 55 mV. (B) The pmf dependency of ATP synthesis/hydrolysis and determination of pmfeq. The initial rate of synthesis/hydrolysis was calculated from the exponential fit 0–200-s portions (red curves in A) and plotted against their pmf values. Experiments were repeated at least three times (dots beside the circle) and averaged (black open circles). The data points were fitted with an exponential function, and pmfeq (red circle) was obtained at the point of rate = 0. An error bar of pmfeq (red horizontal bar) was made from the fitting curves for the largest or the smallest rates at each pmf.

