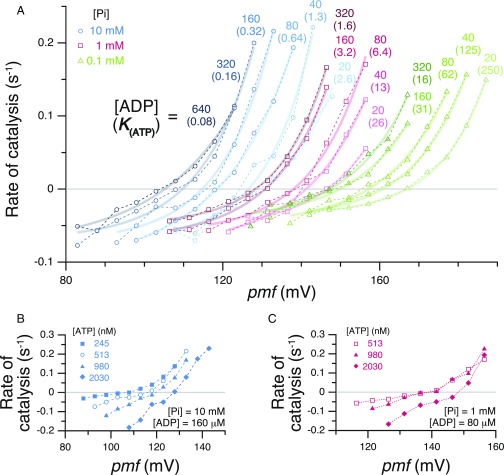
Fig. 2.
The pmf dependency of ATP synthesis/hydrolysis at different K(ATP). (A) [ATP] = 512 nM. [Pi] = 10 mM (cyan circles), 1 mM (magenta squares), or 0.1 mM (green triangles). [ADP] and K(ATP) are shown on the top of each trace (the latter is in parentheses). (B and C) [ATP] was changed. [ATP], [ADP], and [Pi] are shown in the figure. Error bars are omitted for clarity (plots with error bars are shown in Fig. S1).

