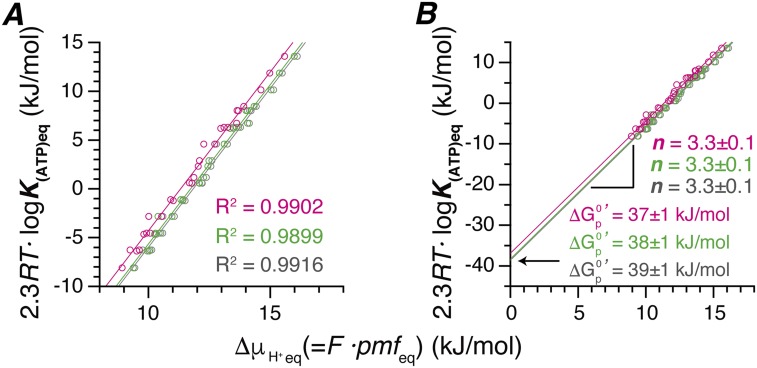
Fig. S2.
Effects of several factors on H+/ATP-ratio and . (A) Chemical potential of ATP synthesis vs. electrochemical potential of H+ at the point of equilibrium (no net ATP synthesis/hydrolysis). All data of the present study are plotted. Values of Δψ were calculated by the Nernst equation (gray, the same as Fig. 3) using K+ concentrations, [K+]in and [K+]out, (magenta) using the activities of K+ instead of the concentrations, or (green) after taking into account the increase in [K+]in caused by K+ influx to PLs upon addition of valinomycin. Plots were fitted with a linear function by the least squares method. (B) The traces in A are extrapolated to their y-intercept region. The resulting coefficient of determination (R2), n value (H+/ATP-ratio),y and are shown beside of the traces.

