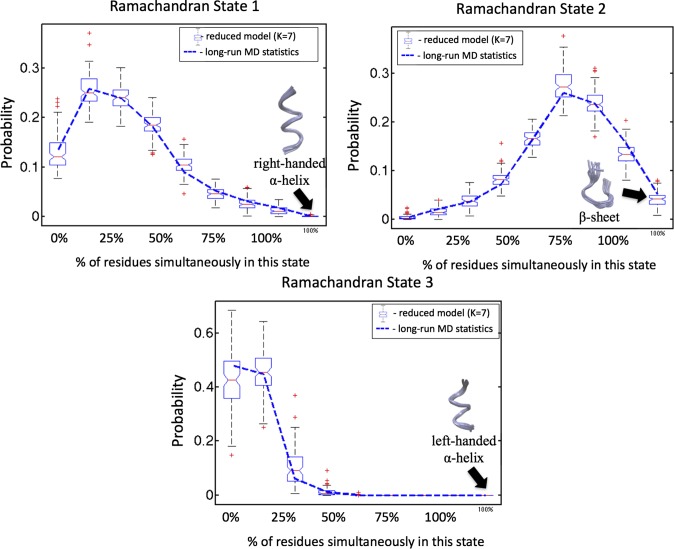
Fig. 2.
Probabilities for different proportions of the chain in the same local Ramachandran state; 100% means that all of the residues in the chain are in this Ramachandran state, and 0% means that there is not a single residuum in this state. The blue lines indicate the values of this distribution obtained from the full MD simulation data, and the box plots show the probability distribution and its 95% confidence intervals obtained from the optimal reduced model run with seven colvars () and nonlocal causality boxes. Red points denote the statistical outliers of the reduced model (meaning that they are outside of the 99% confidence interval). Respective distributions for a completely independent model (i.e., for a model where 100% of causality boxes are local) are shown in SI Appendix.

