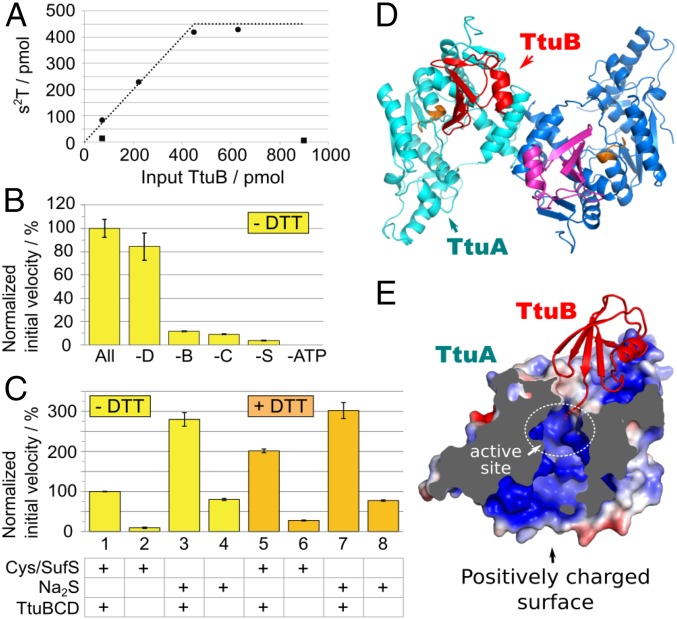
Fig. 4.
(A–C) In vitro characterization of s2T synthesis. The 2-thiolation reaction of yeast tRNAPhe (450 pmol; 7.5 pmol/µL) was examined at 60 °C with various combinations of the recombinant proteins, ATP, and sulfur donors. (A) The 2-thiolation reaction using TtuB-COSH as a sulfur donor. The reaction was performed in the presence of 75 pmol (1.25 pmol/µL) holo-TtuA, 2.5 mM ATP, and various amounts of either TtuB-COSH (closed circle) or TtuB-COOH (closed square) for 1 h. The x- and y-axes represent the amounts of input TtuB and s2T formed, respectively. The dotted line represents the maximum possible values of s2T had all of the sulfur atoms of input TtuB-COSH been incorporated into s2T. The value plateaus at 450 pmol because that was the amount of tRNA present. (B) The reaction was performed in the presence of all protein factors (holo-TtuA, TtuB, TtuC, TtuD, and SufS), 0.1 mM Cys, and 2.5 mM ATP in the absence of DTT (All). −D, −B, −C, −S, and −ATP represent the absence of TtuD, TtuB-COOH, TtuC, SufS, and ATP in each reaction mixture, respectively. Holo-TtuA (9.4–75 pmol; 0.16–1.25 pmol/µL) and other proteins (75 pmol; 1.25 pmol/µL) were included in reaction mixtures. The initial velocity of s2T formation is presented relative to that of the complete mixture (0.349 ± 0.027 pmol s2T/pmol TtuA/min). The experiment was performed in triplicate, and the data are presented with SD values. (C) The initial velocity of s2T formation was measured with 0.1 mM cysteine and 75 pmol (1.25 pmol/µL) SufS (assays 1, 2, 5, and 6), or 0.1 mM Na2S (3, 4, 7, and 8) as sulfur donors. 0.1 mM DTT was included in assays 5–8. Holo-TtuA (9.4–75 pmol; 0.16–1.25 pmol/µL) was included in all of the reaction mixtures. The values are presented relative to assay 1 (0.356 ± 0.002 pmol s2T/pmol TtuA/min). TtuB-COOH, TtuC, and TtuD (75 pmol; 1.25 pmol/µL) were included in assays 1, 3, 5, and 7. The experiment was performed in triplicate, and the data are presented with SD values. (D and E) Crystal structure of TthTtuA-TtuB (G65C) complex. (D) Overall structure of the TtuA-TtuB complex. Two protomers of TtuA dimer are colored in cyan and blue, and two molecules of TtuB are in red and magenta. The PP-loop is shown in orange. (E) Sectional view of the TtuA-TtuB complex. The surface of TtuA is colored according to the electrostatic potential (red, −4 kT/e; blue, +4kT/e) calculated with APBS (48, 49). The position of the catalytic site is indicated by a white dotted circle.

