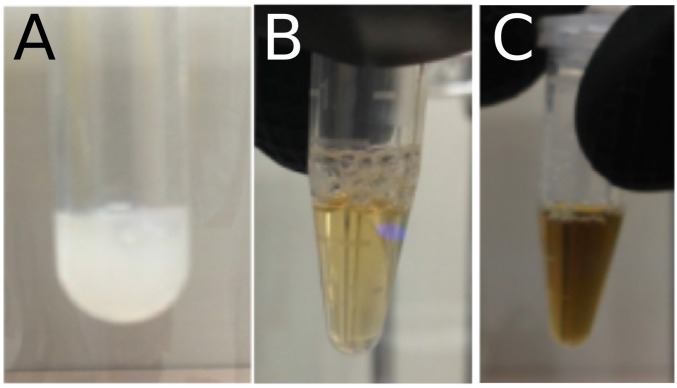
Fig. S3.
The state of the TthTtuA sample in purification. (A) A large amount of white precipitation present under aerobic conditions. (B) Light-yellow color of the TthTtuA sample after purification in anaerobic conditions. (C) Dark-yellow color of TthTtuA sample after the Fe-S cluster reconstitution. In both B and C, the concentration is ∼4 mg mL−1.

