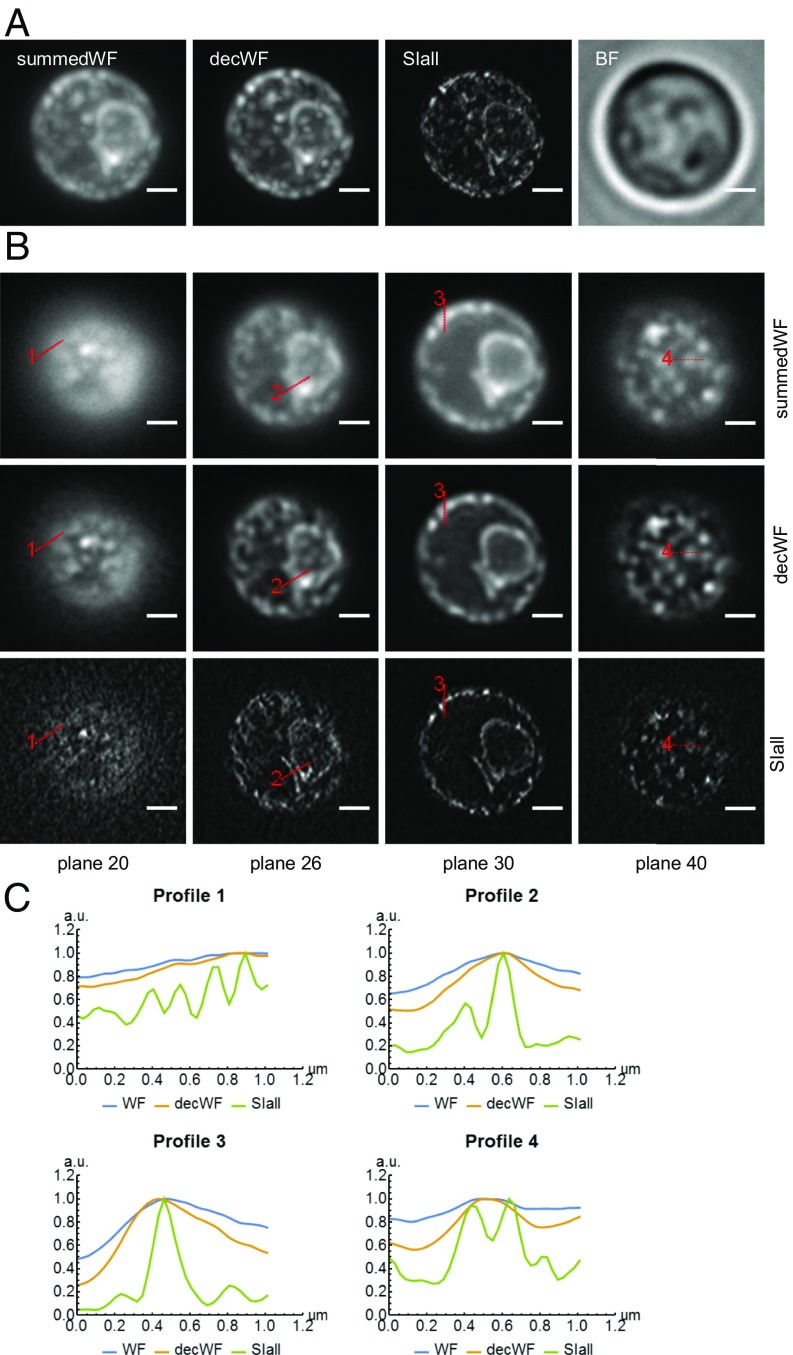
Fig. 6.
High-resolution images of GFP-tagged ER structure within live yeast cells embedded in 1.5% low-melt agarose. (A) Maximum-intensity projections of conventional wide-field (summedWF), deconvolved wide-field (decWF), and SIM (SIall) image stacks as well as the bright-field (BF) image of a live yeast cell. (B) Four planes were chosen to allow a more detailed comparison between the summedWF, decWF, and the SIall image. The detailed structure of the ER, which appears to be quite blurry in both summedWF and decWF images, is resolved in the SIM images. The image stack consists of 50 planes with an axial spacing of 200 nm. (Scale bars, 1 μm wide.) (C) The line profiles of the SIM (SIall) image show the ER structure, which cannot be observed in either the summedWF or the decWF image.

