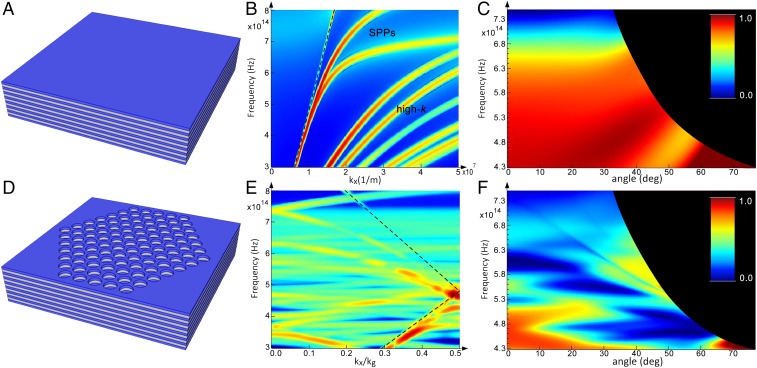
Fig. 1.
Bandstructure and reflectivity. (A) Schematic of HMM composed of multiple periods of Ag and Al2O3. (B) Bandstructure of HMM. Light line is marked as a dashed line. Two SPP modes are noticeable near the light line. The remaining modes are coupled bulk plasmons known as high-k modes that are characteristic of HMMs. (C) Simulated reflectivity of a plane-wave source from an HMM. The black circle marks the edge of the source angle for a given frequency (SI Appendix, section 2). (D) Schematic of PHC. Two-dimensional periodic arrays of holes in a triangular lattice are defined on the HMM extending down through the first two periods. (E) Bandstructure of PHC. Folding of bands accompanied by intermodal coupling is observed below the light line. (F) Simulated reflectivity of a PHC. The wide blue regions mark angle and frequency ranges for which reflectivity drops near zero, indicating efficient in-/outcoupling of light. The two thin faint bands in the upper portion of the graph are the −1 diffraction order of the two SPPs which appear in B.

