Fig. 2.
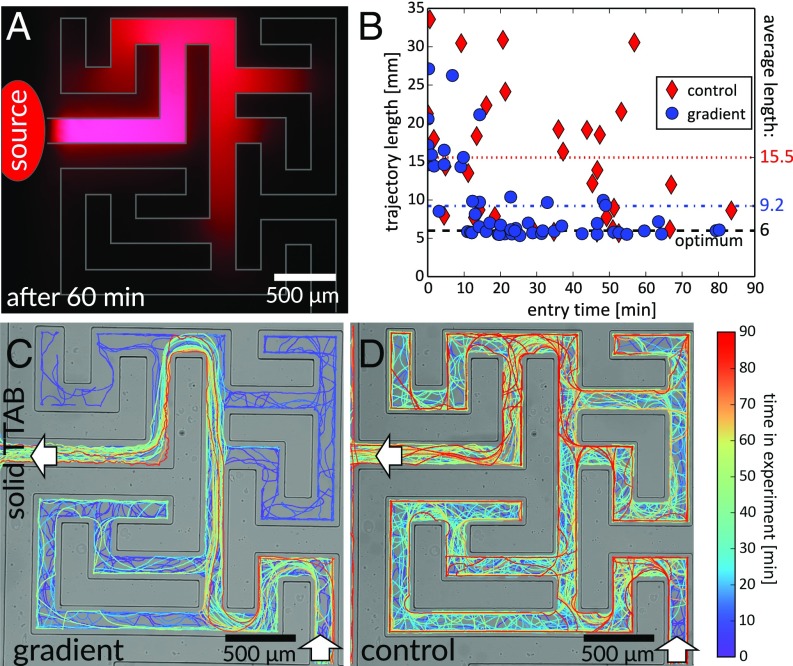
Maze solving by chemotactic droplet swimmers. White arrows indicate maze entrance and exit. (A) Solid TTAB mixed with fluorescent Nile Red spreading in the maze; distribution after 60 min. “Source” marks the point of release (the excitation LED was shaded in this area to improve contrast). (C and D) Trajectories with and without TTAB gradient. We selected only swimmers that passed both entrance and exit points. Line colors correspond to the time in the experiment. In C, detours are mostly for early times (purple) whereas in D there is no correlation. (B) Plot of path lengths vs. entry time, compared with the shortest path length ( mm) (Movies S1–S3).

