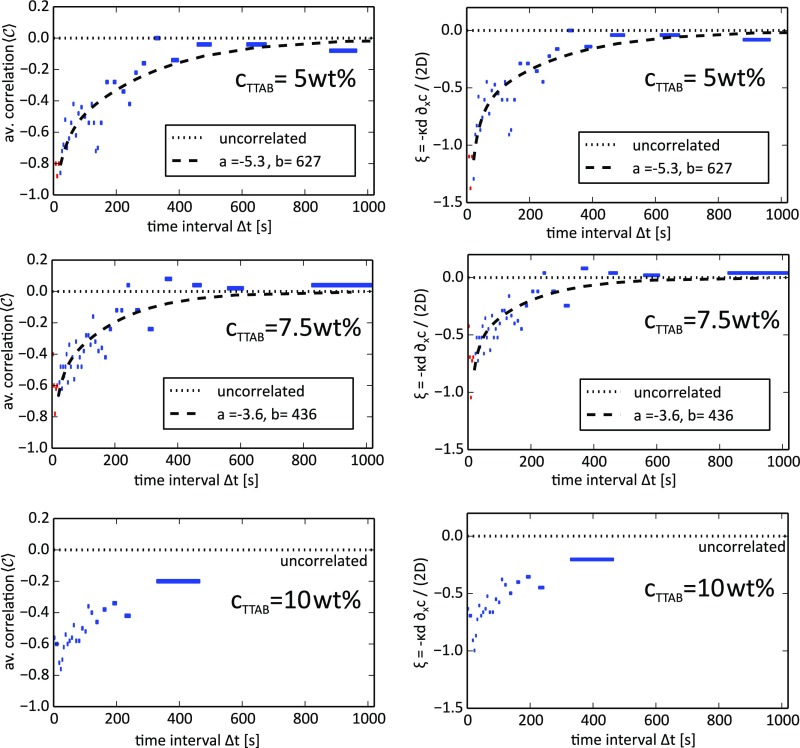
Fig. S2.
Correlation and vs. the time interval at variable . The fit of to our analytical model (Eq. S4) and the corresponding function for are shown as black dashes. As our model is not applicable for small , the data points marked in red were not used in the parameter fit. Data were binned by , using events per bin, and then averaged (the corresponding range is marked by the bar width). By fitting using Eq. S4, we obtain for wt% the parameters and , and for wt% the parameters and . We provide no fit for wt% due to insufficient statistics in the long time limit.

