Fig. S1.
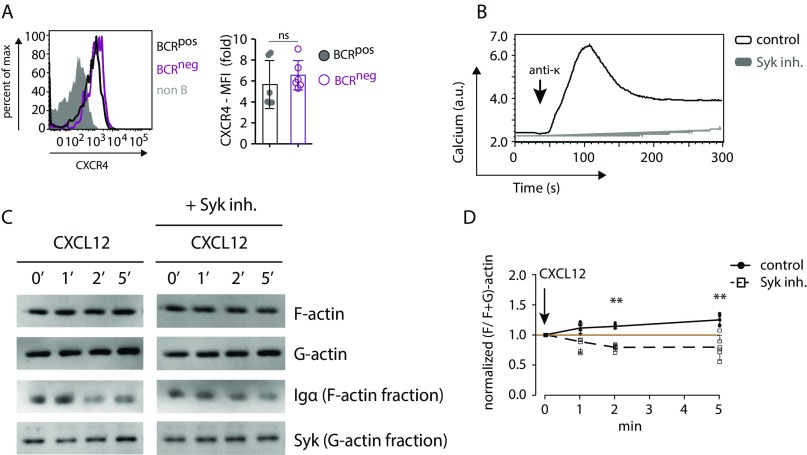
Signaling through CXCR4 is coupled to the BCR via Syk and the actin cytoskeleton. (A) Expression of CXCR4 in BCRpos (black) and BCRneg (purple) splenic B cells by FACS analysis (Left) and mean fluorescence intensity (MFI) quantification (Right). (B) Calcium flux measurement of splenic B cells in response to 5 µg/mL anti-κLC in absence (control, black) and presence of 1 µM Syk inhibitor (gray). (C) Representative Western blot analysis of F- and G-actin fractions of splenic B cells in response to 100 ng/mL CXCL12 stimulation in the absence and presence of 1 µM Syk inhibitor. (D) Quantification of F-actin fraction dynamics in response to 100 ng/mL CXCL12 stimulation. Analysis of CXCR4 expression in A and calcium flux analyses in B are representative of six and four independent experiments, respectively. Quantification of F- and G-actin fractions in D represents mean ± SEM of four or more independent experiments. **P < 0.01.

