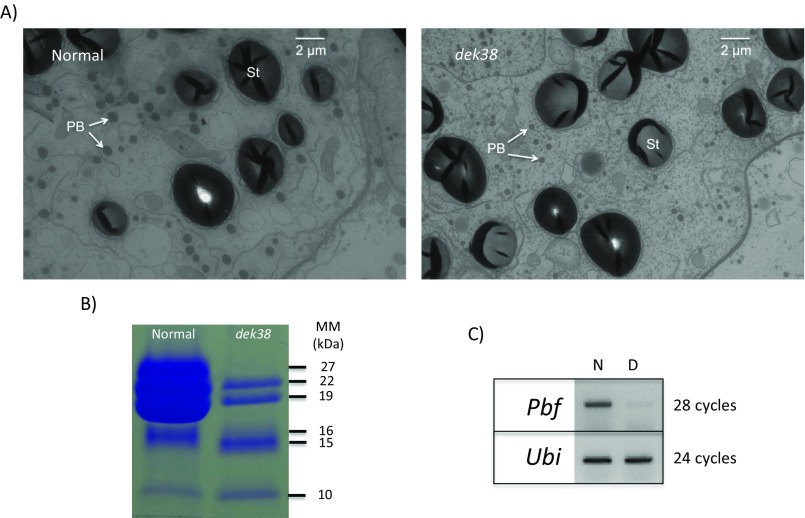
Fig. S4.
(A) Transmission electron micrograph of a normal (Left) and dek (Right) seed from the dek38-Dsg mutant (PB, protein body; St, starch granule). (B) Zein protein profile of a dek seed from the dek38-Dsg mutant compared with a normal kernel (MM, protein molecular mass in kilodaltons). (C) Gene expression (RT-PCR) of Pbf gene (N, normal; D, dek).

