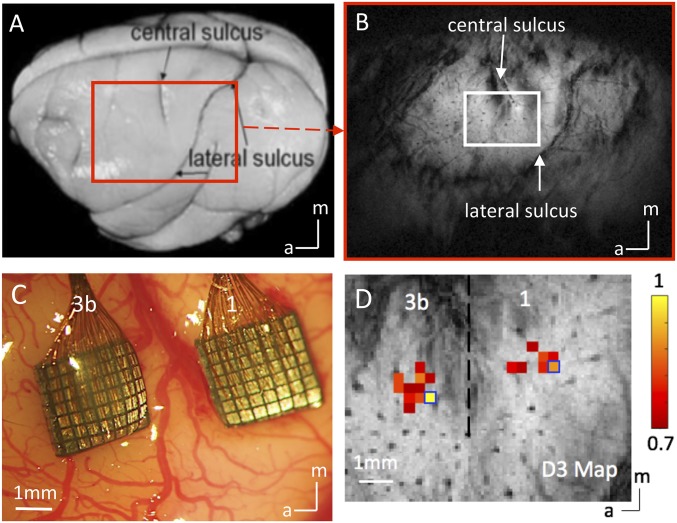
Fig. 4.
Experimental set up for mapping areas 3b and 1 of S1 cortex with submillimeter-resolution fMRI and 98 channel Utah array. (A) Major landmarks used to identify digit regions in areas 3b and 1 of S1 are visible on the postmortem squirrel monkey brain. The red box indicates the imaging field of view. (B) In an oblique coronal image acquired with T2* weighting, sulci and surface and transcortical vessels appear as dark lines and dots. (C) Blood vessel map shows the two 7 × 7 multichannel electrode arrays were inserted in the digit regions of areas 3b and 1 under surgical microscope in one representative monkey. (D) Corresponding BOLD fMRI activation map to vibrotactile stimulation of the D3 distal finger pad in areas 3b and 1 of S1 cortex. Normalized percentage signal change maps were thresholded at 0.7. Dotted black line indicates the approximate border between areas 3b and 1. Blue boxes show the selected seed voxels used in resting state functional connectivity analysis. (Scale bar, 1 mm.) a, anterior; m, medial.

