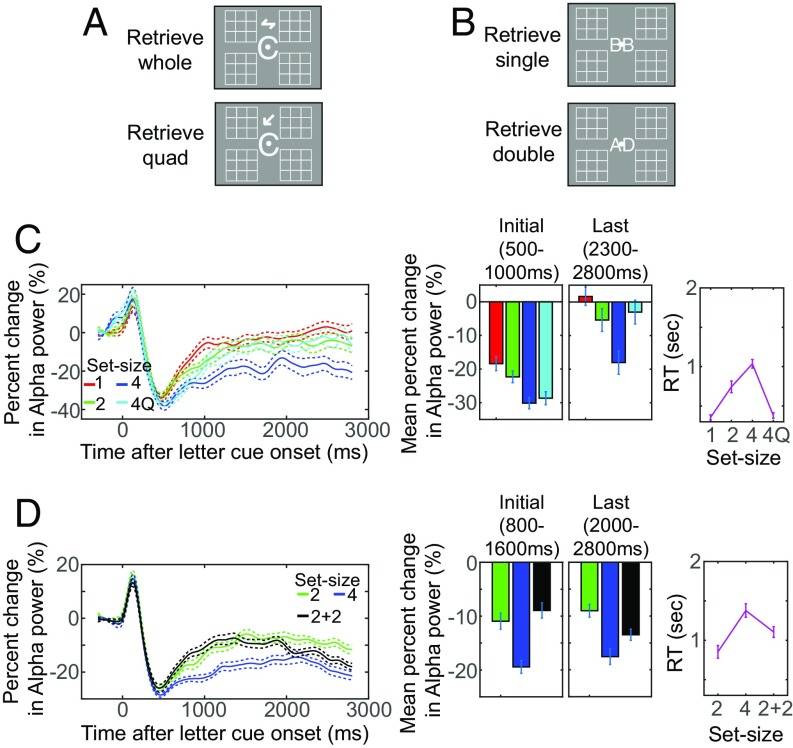
Fig. 2.
The experimental paradigms and the results for experiments 2 and 3. (A) The retrieval cues used in experiment 2. (B) The retrieval cues used in experiment 3. (C and D) The results for the retrieval task in experiments 2 and 3. Waveforms on the Left show the modulation of the parieto-occipital alpha power during the retrieval task for experiment 2 (C) and experiment 3 (D). The dotted margins indicate the within-subject SEM at a given time point, and the time value on x axis for the alpha-power suppression reflects the center of 400-ms-long sampling window. The bar graphs show the mean alpha-power suppression during corresponding retention intervals. The line graphs on the Right shows set size functions derived from median RT during the retrieval task for experiment 2 (C) and experiment 3 (D). The error bars show the within-subject SEM.

