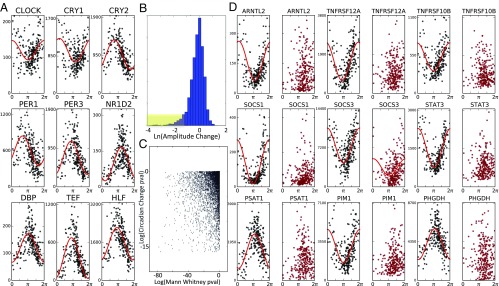
Fig. 3.
CYCLOPS analysis of noncancerous (NC) and cancerous (HCC) human liver. Expression data from biopsy-derived NC tissue was processed using CYCLOPS. (A) Reconstructed expression profiles of selected clock genes are plotted as a function of CYCLOPS phase. Expression data from samples with HCC were projected onto the eigenvectors established in the NC samples before CYCLOPS ordering. (B) Histogram of circadian amplitude differences between NC and HCC samples. A long tail, highlighted in yellow, shows transcripts with reduced amplitude in HCC. (C) A scatter plot compares the statistical significance of testing for a change in mean expression (Mann–Whitney test) with the statistical significance of testing for a circadian expression change. (D) Expression of selected genes as a function of CYCLOPS phase in both NC (black) and HCC (red) samples.

