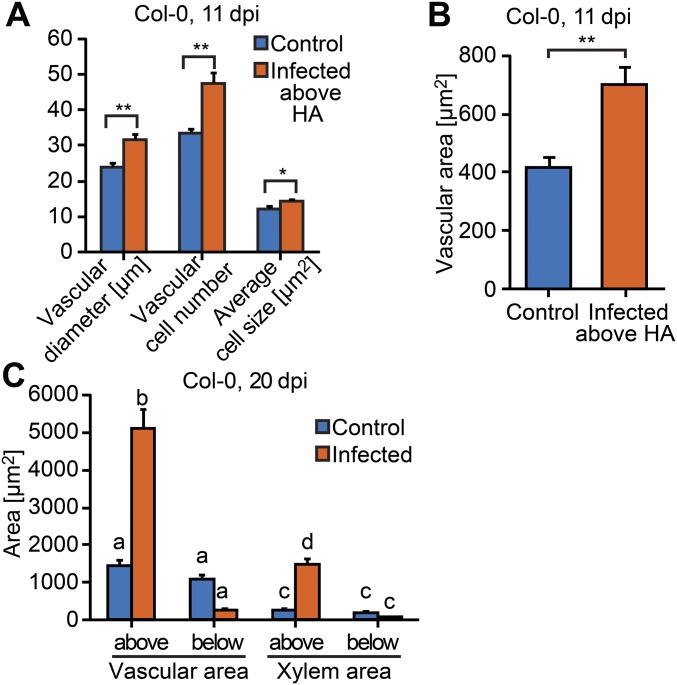
Fig. S3.
Characterization of Phtheirospermum-induced hypertrophy. Root transverse sections of Arabidopsis Col-0 control (blue) and Phtheirospermum (Pj) infected (orange) plants were used to determine changes in vascular diameter, vascular cell number, and average vascular cell size (A) and vascular area at 11 dpi (n = 28–31, **P < 0.01, *P < 0.05; Student’s t test) (B). (C) Quantification of vascular area and xylem area at 20 dpi (n = 6–31, ANOVA, P < 0.01). Bars represent mean ± SE.

