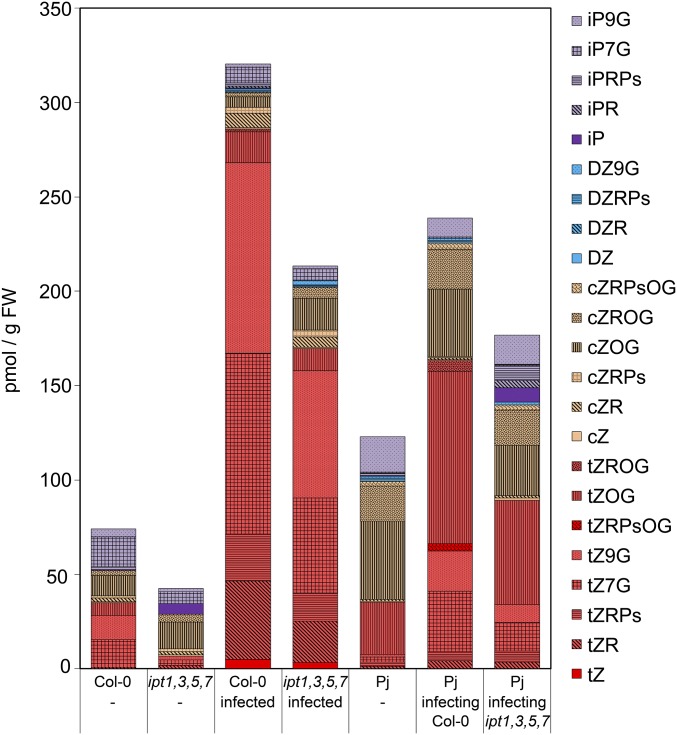
Fig. S7.
Cytokinin profiles in different hosts and Phtheirospermum. Cytokinin profiles were determined by UPLC-tandem mass spectrometry of control plants (-) or infected plants on Phtheirospermum, Col-0 or ipt1,3,5,7 mutants. Bars show average values of four independent experiments at 11 dpi. iP, N6-(∆2-isopentenyl)adenine; iPR, iP riboside; iPRPs, iPR 5′-phosphates; iP7G, iP-7-N-glucoside; iP9G, iP-9-N-glucoside; DZ, dihydrozeatin; DZR, DZ riboside; DZRPs, DZR 5′-phosphates; DZ9G, dihydrozeatin-9-N-glucoside; cZ, cis-zeatin; cZR, cZ riboside; cZRPs, cZR 5′-phosphates; cZOG, cZ-O-glucoside; cZROG, cZR-O-glucoside; cZRPsOG, cZRPs-O-glucoside; tZ, trans-zeatin; tZR, tZ riboside; tZRPs, tZR 5′-phosphates; tZ7G, tZ-7-N-glucoside; tZ9G, tZ-9-N-glucoside; tZOG, tZ-O-glucoside; tZROG, tZR-O-glucoside; tZRPsOG, tZRPs-O-glucoside.

