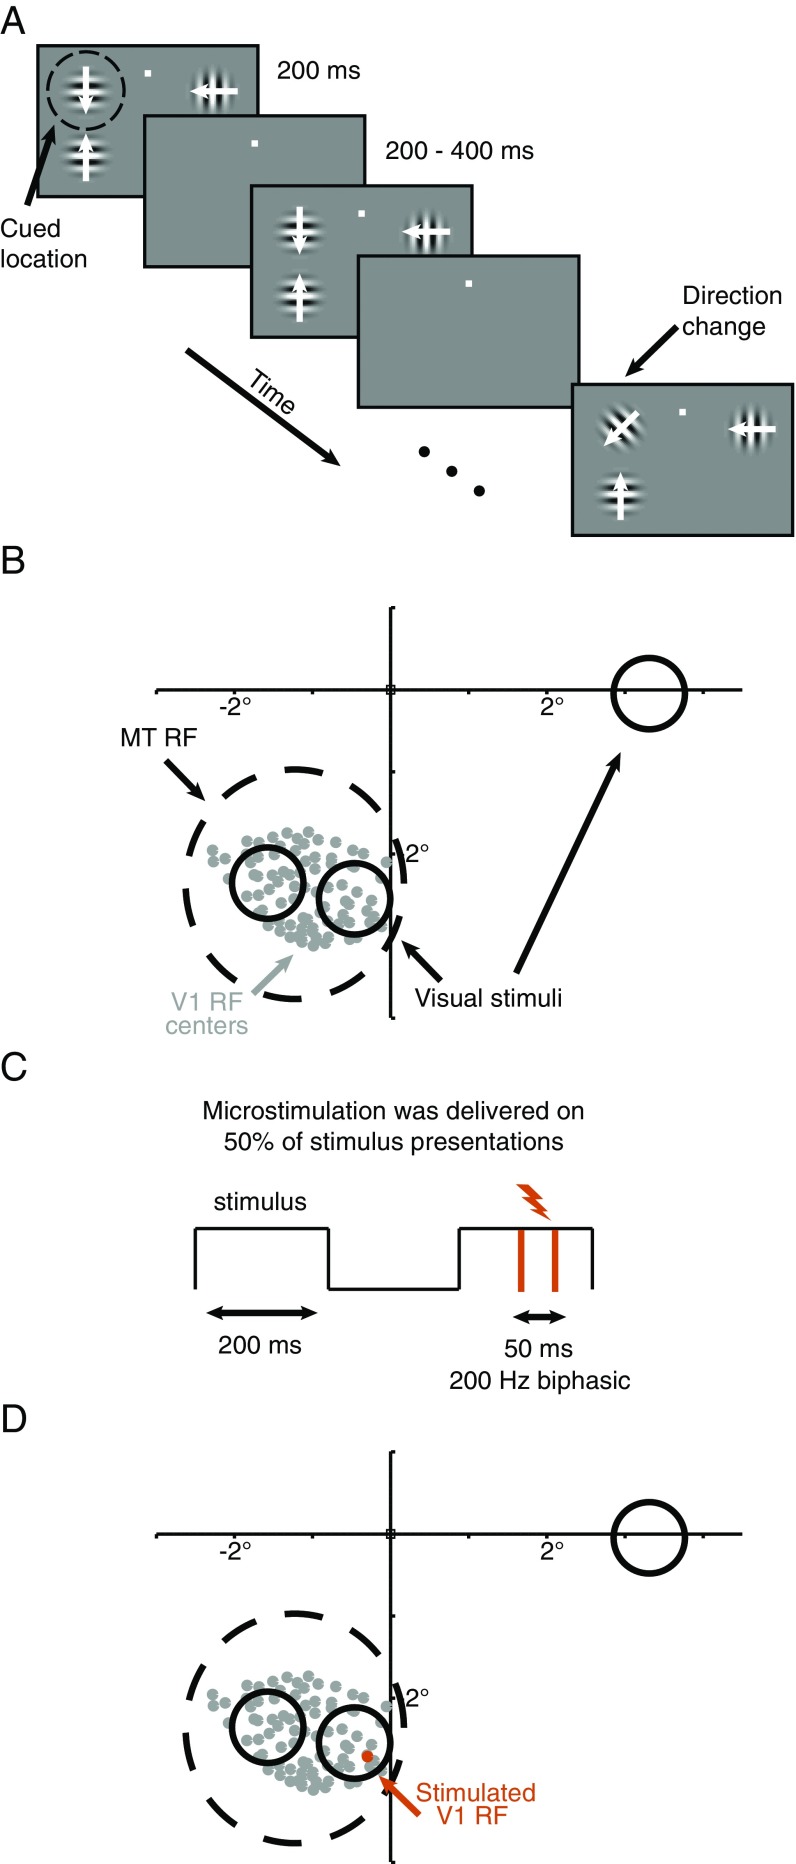
Fig. 2.
Recording, microstimulation, and psychophysical methods. (A) Schematic of the motion direction change detection task used in all experiments. Once the monkey fixated a central spot, either two or three small Gabor stimuli synchronously flashed on for 200 ms and off for a randomized 200- to 400-ms period. Two of the stimuli were positioned inside the joint receptive fields of the MT and V1 neurons we recorded, and the third (when present, which was on one out of every three blocks of trials) was placed in the opposite hemifield. After an unsignaled and randomized number of stimulus presentations (picked from an exponential distribution, minimum 2, mean 6, maximum 14 stimulus presentations), the direction of one of the stimuli changed. The monkeys were cued in blocks of 50–100 trials to detect changes in (and therefore attend to) one of the stimuli and ignore motion direction changes in the other stimulus locations. The monkeys were rewarded for making a saccade to the attended stimulus within 500 ms of the stimulus change. Distractor changes were never rewarded. The contrasts of the stimuli were either all 8% or all 100%, and contrast was randomly interleaved on each stimulus presentation. The two stimuli within the receptive field moved in opposite directions (the preferred and null directions of the MT cell under study for the experiments used to measure spike count correlations and fit the models), and which of the two stimuli moved in the preferred direction varied randomly from trial to trial. When present, the stimulus in the opposite hemifield moved in a direction that was orthogonal to the directions of the stimuli inside the MT units’ receptive fields. (B) Receptive fields and visual stimulus locations from an example experimental session. We recorded simultaneously from a 96-channel chronically implanted microelectrode array in area V1 and a single electrode or a movable 24-electrode probe in area MT. We selected MT units whose receptive fields (black dashed circle in this example) overlapped the envelope of receptive fields of the neurons we recorded in V1 (centers denoted by the gray dots). The locations and approximate sizes of the visual stimuli are denoted by the solid black circles. For the electrical microstimulation experiments, (C) microstimulation was delivered for 50-ms pulses at 200 Hz during a randomly selected 50% of stimulus presentations in each trial. (D) Channels were selected for microstimulation if the receptive fields of the neurons on them clearly overlapped with just one stimulus, as the orange receptive field center does, and if microstimulation led to an observable change in MT firing rates during microstimulation.

