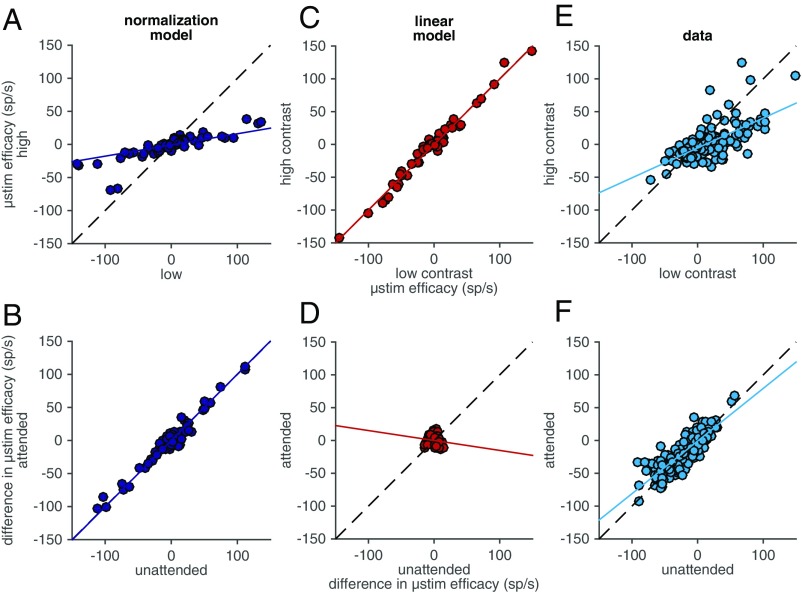
Fig. 4.
Electrical microstimulation results support the normalization model. (A) Predictions of the normalization model for the number of extra MT spikes elicited by V1 microstimulation when the visual stimulus was high contrast (y axis) vs. low contrast (x axis). The dashed line is unity, and the solid line is the best fit line to the model’s predictions. (B) Predictions of the normalization model for the difference between the numbers of extra MT spikes elicited by V1 microstimulation during high- and low-contrast visual stimulus presentations when the animal attends (y axis) or ignores the visual stimulus overlapping the receptive fields of the stimulated V1 neurons. Conventions as in A. (C and D) Same as A and B for the linear model. (E and F) Same as A and B for actual data.

