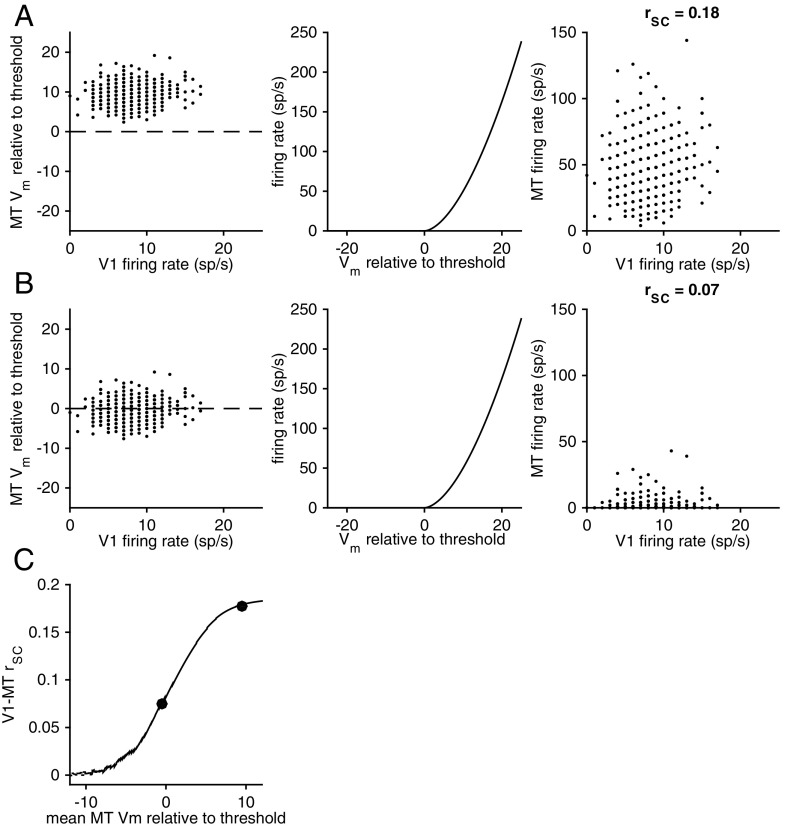
Fig. 6.
V1–MT correlations depend monotonically on the MT neuron’s membrane potential. (A and B, Left) Membrane potentials of simulated MT neurons that differ only in their membrane potential relative to threshold as a function of the firing rate of a simulated V1 neuron. In both cases, the correlation between V1 and MT membrane potentials was picked to be 0.2. (A and B, Center) The nonlinear relationship between the neuron’s membrane potential and firing rate (picked to be realistic, although the exact shape of the nonlinearity does not qualitatively affect the results). (A and B, Right) When the mean membrane potential of the MT neuron is substantially above threshold, the spiking correlation between the simulated V1 and MT neurons is similar to the membrane potential correlation. When the mean membrane potential of the MT neuron is low, however, the spiking correlation is lower than the membrane potential correlation. (C) Summary of the relationship between the relative membrane potential of the MT neuron and the spiking correlation.

