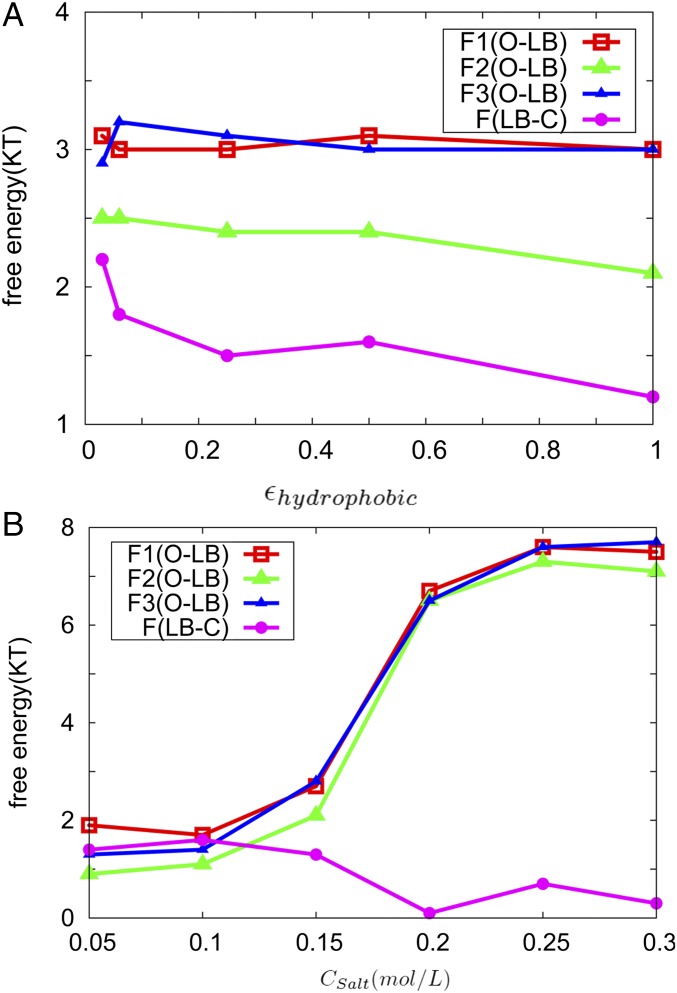
Fig. 2.
The barrier heights along each pathway in different electrostatic and nonnative hydrophobic interaction strengths. Fi(O–LB) (i = 1,2,3) shows the barrier heights for the pathway O–Ii–LB. F(LB–C) is the barrier height for LB–C. (A) Barrier height changes with different strength of nonnative hydrophobic interactions. is the parameter representing the strength of the LJ potential of the nonnative hydrophobic contacts in the Hamiltonian energy (SI Appendix, Materials and Methods), altering the strength of the nonnative hydrophobic interaction. (B) Barrier height changes with different salt concentrations. is the salt concentration.

