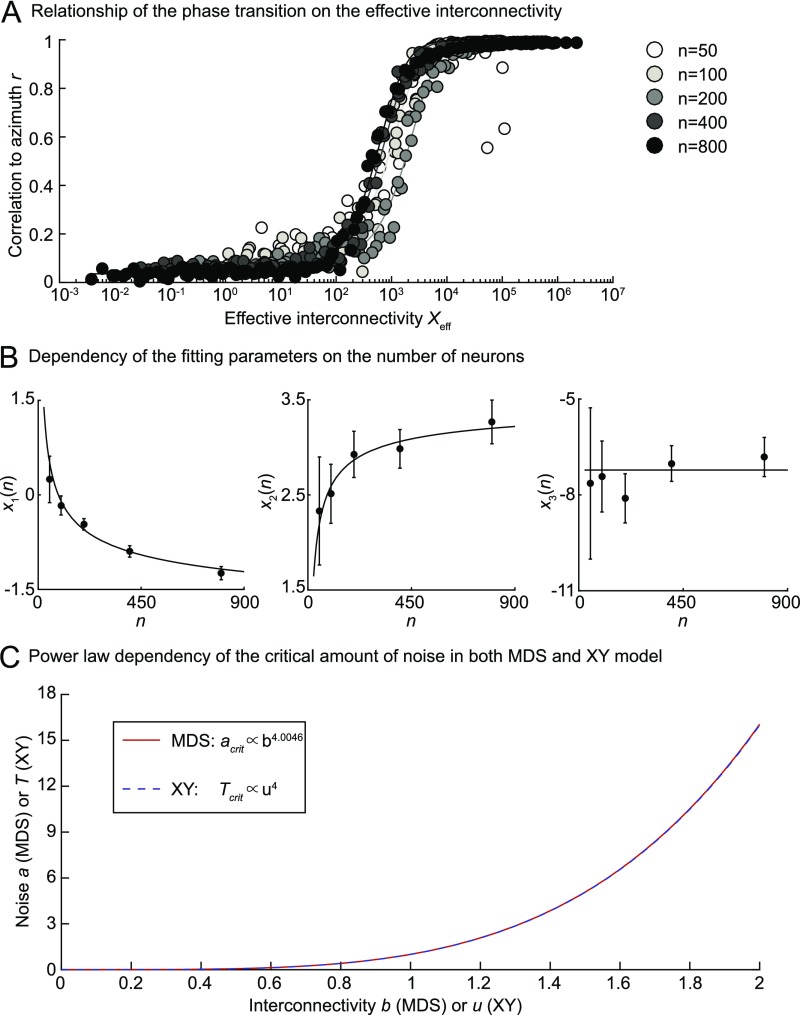
Fig. S4.
Relationship between phase transitions in the MDS and the XY models. (A) Fit of the correlation to the azimuth r of OP maps calculated with our MDS model for different numbers of neurons (shown as different shades of gray) and a large range of values for a and b. Original data points are shown in the space of the effective interconnectivity Xeff, which was calculated using the fitted parameters. The following ranges of a and b values have been used to obtain the fits for different numbers of neurons: n = 50 (a = [1.4236, 34.1995]; b = [1.3594, 21.5443]), n = 100 (a = [1.4236, 69.3145]; b = [1.3594, 39.8107]), n = 200 (a = [1.4236, 140.4844]; b = [1.3594, 73.5642]), n = 400 (a = [1.4236, 200]; b = [1.3594, 100]), and n = 400 (a = [1.4236, 200]; b = [1.3594, 100]). (B) Dependency of the fitting parameters (Left) x1, (Center) x2, and (Right) x3 on the number of neurons n. Data points show the mean values, and the error bars show the lower and upper limits of the respective fitting parameters. Lines are fits of the dependency of x1, x2, and x3 on logarithmic [ with A = −3.56 and B = 15.96], square root [ with A = 3.54 and B = −9.46], and constant [ with A = −7.22] functions. (C) Critical noise has a power law dependence on the interconnectivity in the MDS and the XY models as shown by the curves and the given relationship in Inset. The power law of the MDS model depicted here was obtained for n = 284.

