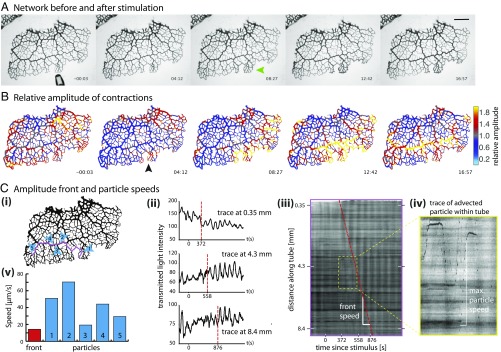
Fig. 1.
Propagating amplitude front. (A) Bright-field images of a P. polycephalum network before (3 s, including approaching pipette) and after stimulation with a droplet of nutrient media. Droplet added at 0 s. Tubes swell where they make contact with the droplet (green arrow). (Scale bar, 2 mm.) (B) The same time points as in A showing contraction amplitude relative to the average over the last 10 periods before stimulation. Stimulation site marked by black arrow. The front (hot colors) spreads preferentially through tubes of larger radii. (C) Amplitude front and particle speeds extracted from bright-field dataset. (i) Locations of particle speed (blue) and front speed (magenta) measures. (ii) Contraction patterns at three different points further and further away from stimulation site. Dotted vertical lines mark sudden changes in contraction amplitude. (iii) Kymograph along trace in i showing change in contraction amplitude, observed as increased contrast during a contraction cycle. Front of increased amplitude propagates over time (red dashed line). (iv) Inset of iii: Particles advected along the tube appear as dark spotted trajectories. (v) Representative maximal speeds of particles (blue), located as pictured in i. Average front propagation speed (red) along trajectory in i as shown in iii.

