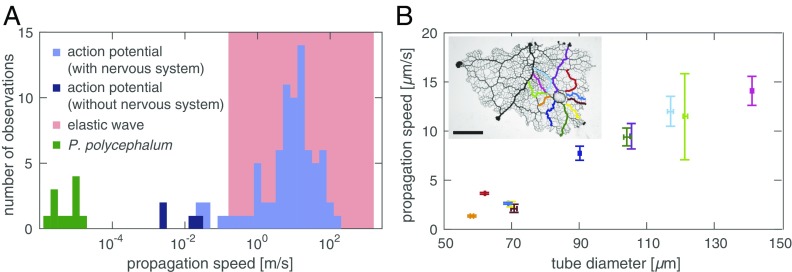
Fig. 2.
Front speed identifies mechanism. (A) Propagation speeds for elastic waves (red), action potentials (blue), (19, 20), and P. polycephalum (green). Wave velocity in a fluid filled elastic tube varies between wave speed in the elastic wall (lower bound) and the fluid only (upper bound) (21). (B) Front speed increases with tube radius as predicted by the model. Amplitude fronts along tubes of a network centrally stimulated by nutrient droplet. Data show average speed and tube diameter with one SD error measured at five locations along the corresponding route (Inset). (Scale bar, 5 mm.)

