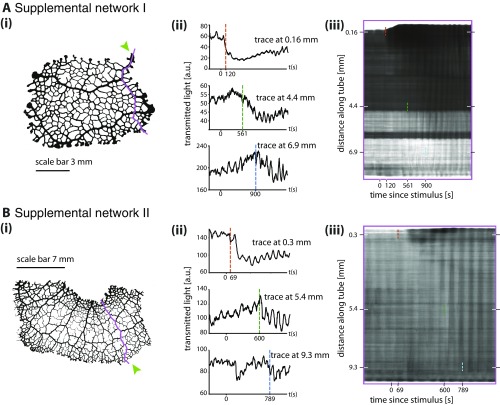
Fig. S1.
Amplitude front propagation in two additional data sets. For both sets (A and B) i shows network morphology and stimulus site (green arrow). ii shows contraction patterns at three different points further and further away from stimulation site. Dotted vertical lines indicate a sudden change in contraction amplitude. iii shows a kymograph along the trace shown in i.

