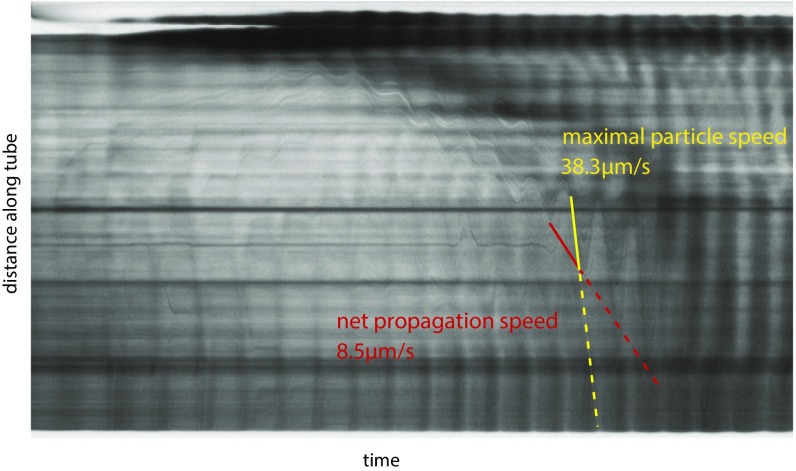
Fig. S2.
Maximal particle speed compared with net particle propagation speed. Shuttle flow of material can be seen in kymographs as sinusoidal patterns. Maximal particle speed (faster, yellow dashed line) corresponds to the steepest part of this sinusoid, whereas net propagation speed (slower, red dashed line) corresponds to incremental movements of the tips of the sinusoids along the tube.

