Fig. 4.
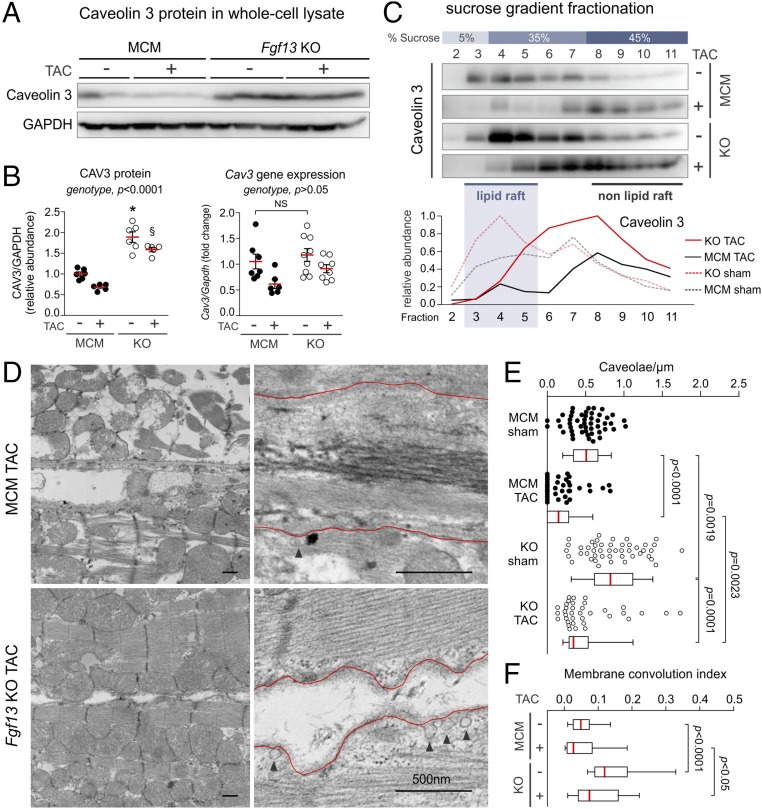
Fgf13 KO attenuates TAC-induced loss of caveolae. (A) Representative Western blots for caveolin 3 in left ventricular whole-cell lysates from MCM and Fgf13 KO hearts 12 wk post-TAC or sham. (B) Densitometry of CAV3 protein from blots in A (Left); gene expression of Cav3 (Right). P values from two-way ANOVA with Sidak’s multiple-comparison test. *P < 0.0001 vs. MCM sham; §P < 0.0001 vs. MCM TAC. (C) Representative Western blots and densitometry showing caveolin 3 distribution in sucrose density fractions from MCM and Fgf13 KO hearts 12 wk post-TAC or sham. (D) Representative electron micrographs from MCM and Fgf13 KO hearts 12 wk post-TAC. (Scale bars, 500 nm; arrowheads denote caveolae connected to plasma membrane; uncropped images in Fig. S7.) (E) Quantification of caveolae density, normalized to membrane length. (F) Quantification of membrane convolution index. Baseline (sham) caveolae densities and membrane convolution indices from Fig. 3 E and G are replotted for comparison with TAC groups. Box plots show medians with interquartile range; whiskers represent 10th to 90th percentile; each point represents one micrograph. n = 37–49 micrographs from three mice per genotype. P values from Kruskal–Wallis test with Dunn’s multiple-comparison test.

