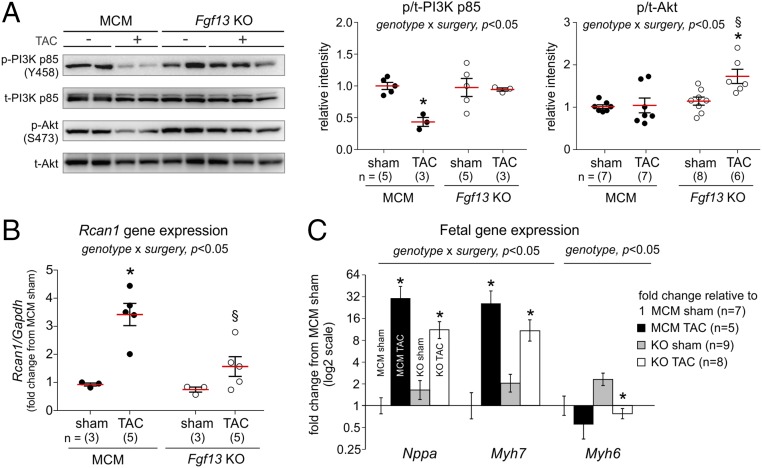
Fig. 5.
Fgf13 KO promotes adaptive hypertrophic signaling in response to pressure overload. (A) Representative Western blots for phosphorylated (p) and total (t) proteins for PI3K p85 and Akt from 12 wk post-TAC hearts. Plots show summarized data for p/t-PI3K and p/t-Akt. (B) Gene expression of regulator of calcineurin (Rcan1) normalized to Gapdh and MCM sham. (C) Gene expression of atrial natriuretic peptide (Nppa), β-myosin heavy chain (Myh7), and α-myosin heavy chain (Myh6) normalized to Gapdh and MCM sham. Fold change on y axis is plotted on a log2 scale. Two-way ANOVA with Sidak’s test for multiple comparisons was used to assess effects of genotype, surgery, and genotype by surgery interaction. *P < 0.05 vs. sham for respective genotype; §P < 0.05 vs. MCM TAC.

