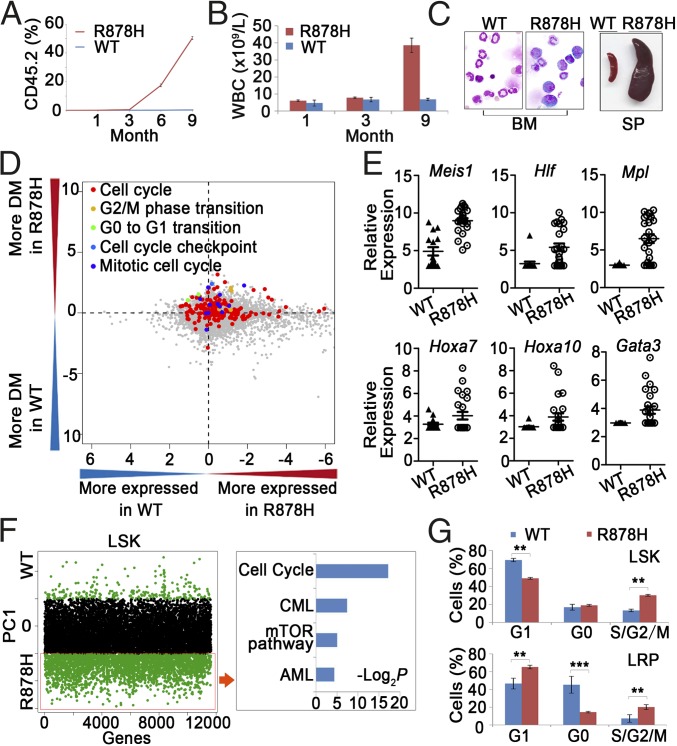
Fig. 2.
Functional analysis of LSKs and single-cell transcriptome profiling of LSKs. (A) The percentage of CD45.2+ cells in the PB of recipient mice (CD45.1+ marker) after transplantation of LSKs. (B) Statistical analysis of cell counts in the PB after transplantation of LSKs. (C) Morphological analysis of BM and SP obtained from the LSK-transplanted mice. (D) Comparison between LSKs from Dnmt3aWT/WT and Dnmt3aR878H/WT mice in terms of their levels of gene expression and heterogeneity for GO categories. The logarithm (log10) of P values from two-sided paired t tests applied to mean normalized read counts (x axis) and DMs (y axis) was computed for each GO category and plotted against each other by multiplying the sign of the t statistic. (E) Expression level of genes associated with hematopoietic differentiation and leukemogenesis in LSKs. (F, Left) Distribution of genes contributing to principal component 1 (PC1) separation based on PCA. Green dots above and below the black dot zone represent down-regulated and up-regulated genes, respectively. (Right) Identification of leukemogenesis-related pathways based on KEGG enrichment analysis. (G) Flow cytometric analyses for the cell cycle of the indicated LSKs and LRPs. Mean ± SEM values are shown. **P < 0.01, ***P < 0.001.

