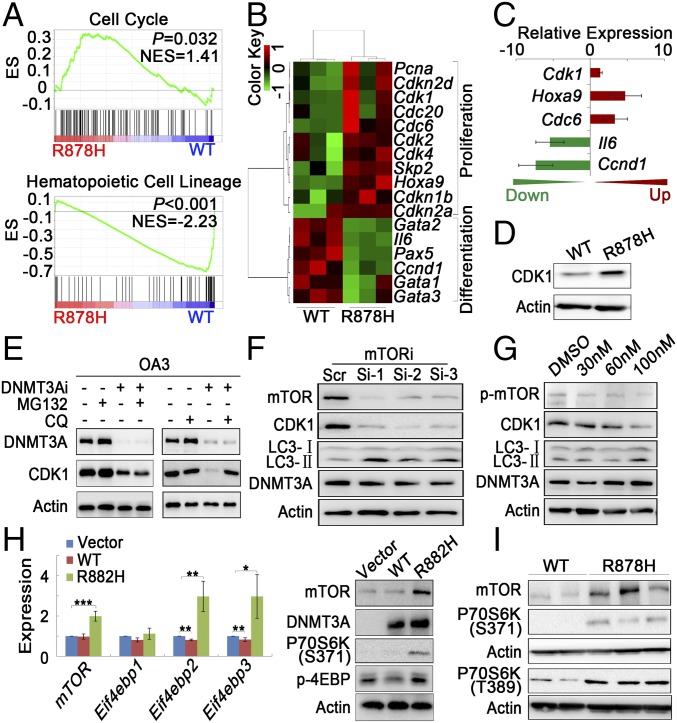
Fig. 3.
Transcriptome profiling of Gr-1+ leukemic cells and mTOR-mediated CDK1 overexpression induced by Dnmt3a mutation. (A) GSEA analysis of differentially expressed genes in Gr-1+ cells. NES, normalized enrichment score. (B) Heatmap of hematopoietic cell proliferation- and differentiation-related genes that are differentially expressed in Dnmt3aWT/WT and Dnmt3aR878H/WT mice. Red and green colors indicate up-regulated and down-regulated genes, respectively. (C) Gene expression levels were validated by RT-PCR. (D) Lysates from BM cells of mice were analyzed by Western blot with the indicated antibodies. (E) OA3 cells transfected with scrambled (DNMT3Ai−) or DNMT3A siRNA (DNMT3Ai+) were treated with MG132 or CQ, and their lysates were analyzed with Western blot. (F and G) Lysates from OA3 cells transfected with three siRNAs (1 to 3) against different mTOR regions or treated with different doses of rapamycin were analyzed with Western blot. (H) Results of RT-PCR and Western blot analysis for mTOR and its downstream genes in NIH 3T3 cells transfected with vehicle, WT, or R882H DNMT3A. (I) Lysates from BM cells of mice were analyzed with Western blot. Mean ± SEM values are shown. *P < 0.05, **P < 0.01, ***P < 0.001.

