Fig. 4.
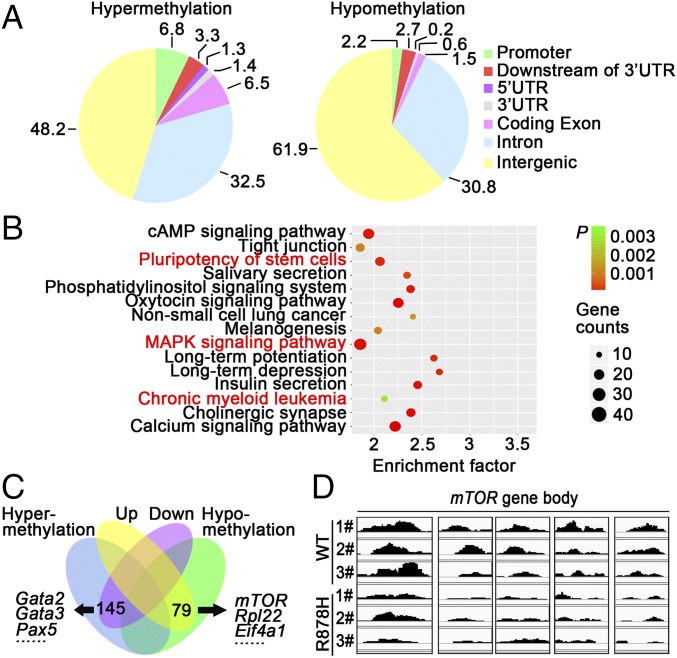
Dnmt3a mutation promotes mTOR expression via hypomethylation. (A) Pie charts showing the average proportions of peaks in each region defined by genomic structure. Peak ratios of hypo- and hypermethylation are shown. (B) Functional analysis of DMRs in murine Gr-1+ cells showed a series of enrichments associated with pluripotency of stem cells and CML. (C) Venn diagram of the overlapping genes enriched in DMRs and differentially expressed genes. (D) MeDIP-seq analysis of the mTOR gene showed a local hypomethylation pattern in the gene body in Gr-1+ cells from Dnmt3aR878H/WT mice compared with that of the Dnmt3aWT/WT control.

