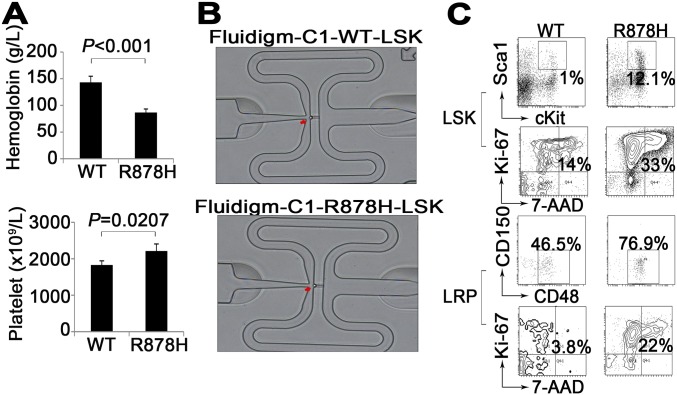
Fig. S2.
(A) Statistical analysis of cell counts in PB from transplanted mice. Mean ± SEM values are shown. (B) A single cell was inspected using a microscope to acquire samples with only one cell captured. (C) Flow cytometric analyses for the cell cycle of the indicated LSKs and LRPs in Dnmt3aWT/WT and Dnmt3aR878H/WT mice.

