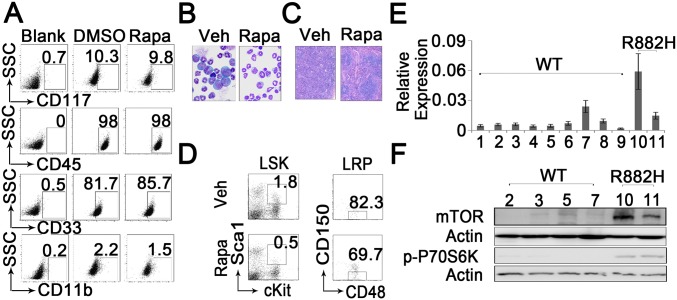
Fig. S6.
(A) Representative flow cytometric plots of AML-related cells treated with DMSO and rapamycin. (B) Morphological analysis of BM with Wright’s staining in Dnmt3aR878H/WT mice treated with vehicle (veh) and rapamycin for 4 mo. (C) Histological analysis of spleen from Dnmt3aR878H/WT mice treated with vehicle and rapamycin for 4 mo. (D) Representative flow cytometric plots and statistical analysis of BM cells obtained from Dnmt3aR878H/WT mice treated with vehicle and rapamycin for 4 mo. (E) RNA expression levels of mTOR in BM samples obtained from AML patients. Mean ± SEM values are shown. (F) Protein expression levels of mTOR in BM samples obtained from AML patients.

