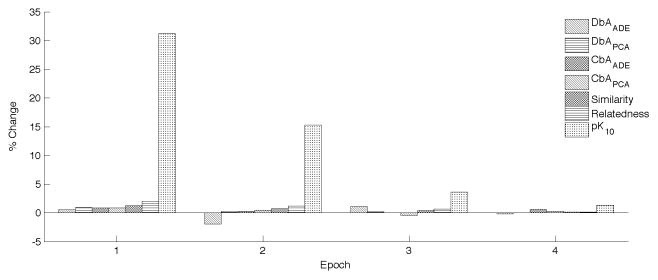
Figure 9.
Percent change in performance from previous iteration. DbA=Discovery-by-Analogy. CbA=Classification-by-Analogy. ADE=Adverse Drug Event set. PCA=Prostate Cancer set. The metric illustrated is the AUROC for all of these aside from CbAADE, where changes in accuracy are shown instead. Similarity and Relatedness show changes in Spearman RhO, measuring correlation to the relevant UMNSRS set. pk10= precision at k=10, for retrieval of explicit relationships.

