Fig. 3.
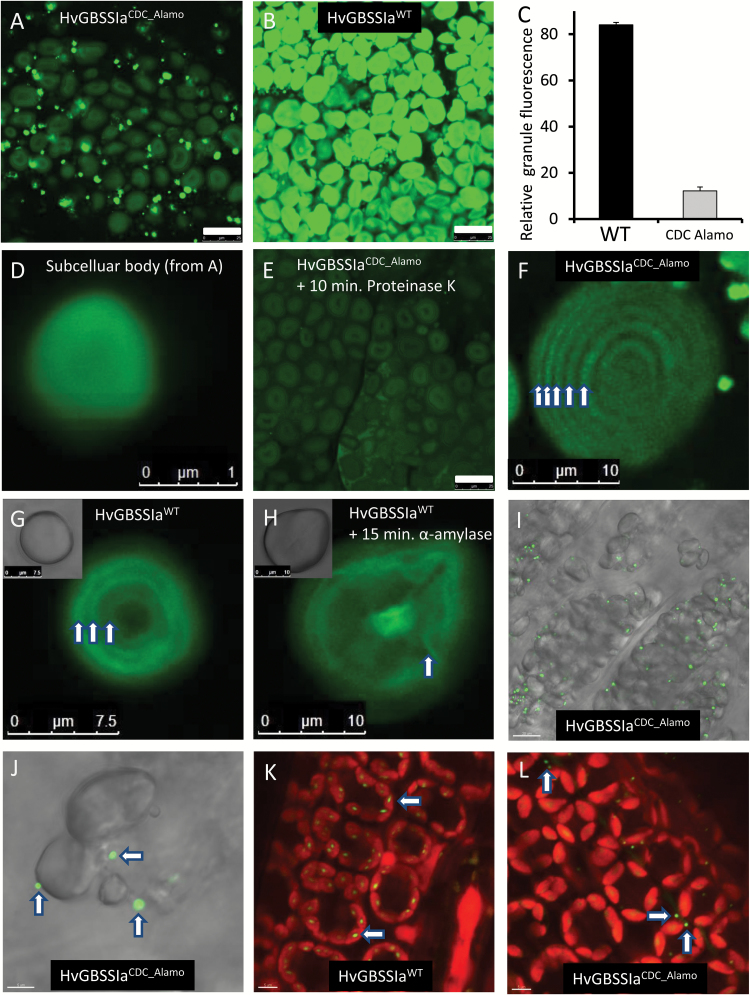
Confocal laser scanning microscopy of starch granules from the endosperm of developing grains at the late grain filling stage (30 DAP) of transgenic barley plants expressing HvGBSSIaWT-eGFP (B, G, H, K) or HvGBSSIaCDC_Alamo-eGFP (A, E, F). (A), (B), (E) and (F) are recorded with same sensitivity, whereas (D), (G) and (H) were recorded with lower sensitivity to avoid oversaturation. (C) The relative fluorescence intensities were much stronger in HvGBSSIaWT-eGFP starch granules than in HvGBSSIaCDC_Alamo-eGFP starch granules (n=10). Bars indicate standard errors. (D) Magnified subcellular body from HvGBSSIaCDC_Alamo-eGFP endosperm cells from panel A. (E) The subcellular bodies in panel (A) disappeared after treatment with proteinase K (1 mg ml–1 in H2O) for 10 min. (G, H) Both HvGBSSIaWT-eGFP and HvGBSSIaCDC_Alamo-eGFP are localized into concentric spheres (indicates by arrows) within starch granules. (H) These concentric spheres became blurred (indicated by the arrow) upon treatment with α-amylase. (I, J) Transmission light was used to visualize subcellular structures in thin sections of endosperm cells simultaneously with localization of HvGBSSIaCDC_Alamo-eGFP recorded as overlaid eGFP fluorescence. (K, L) HvGBSSIaWT-eGFP (green; K) was located in granules inside chloroplasts (red fluorescence) in leaves whereas HvGBSSIaCDC_Alamo-eGFP (L) was mostly localized in subcellular bodies (green, indicated by arrows) outside of the red chloroplasts. The scale bars in (A, B, E) are 25 µm; the scale bar in (I) is 20 µm; the scale bars in (F, H) are 10 µm; the scale bar in (G) is 7.5 µm; the scale bars in (J, K, L) are 5 µm; and the scale bar in (D) is 1 µm.

