Fig. 8.
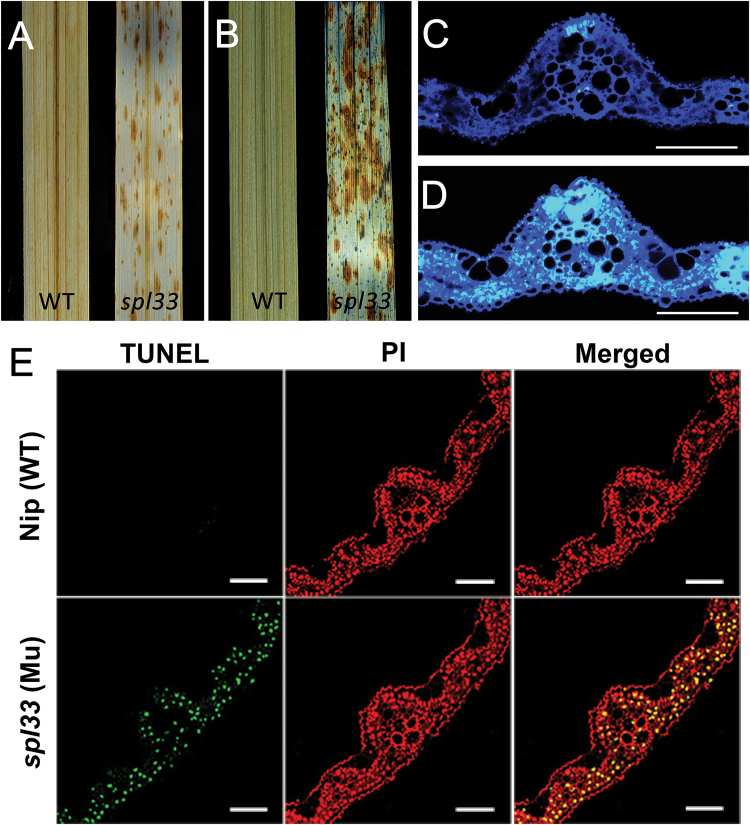
H2O2 accumulation and PCD detection in spl33. (A) DAB staining for H2O2 accumulation. (B) Trypan blue staining for cell death. (C, D) Aniline blue staining for callose accumulation under UV light; fluorescent regions indicate callose accumulation. (C) WT; (D) spl33. Scale bar: 100 μm. (E) DNA fragmentation detection in mesophyll cells by TUNEL assay. Red signal represents staining with propidium iodide, and yellow and green signals indicate TUNEL-positive nuclei of dead cells resulting from PCD. Scale bar: 100 μm. WT and spl33 leaf samples in (A–E) were analysed at 28 DAS.

