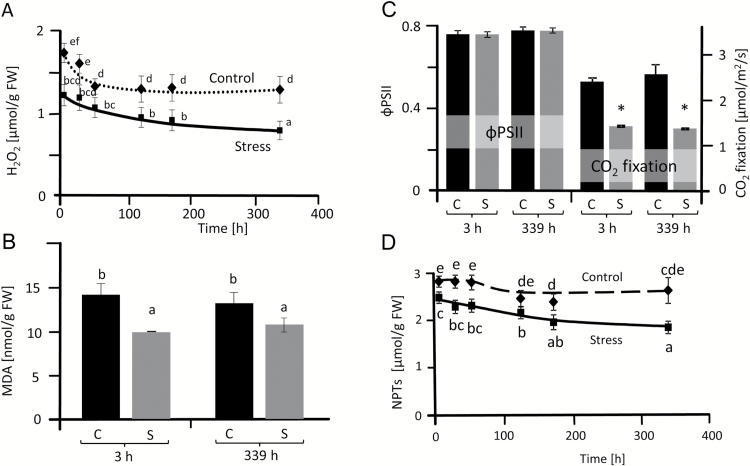
Fig. 2.
Characterization of ROS and antioxidant status of salt-stressed sugar beet. H2O2 content (A), malondialdehyde (MDA) content (B), photosynthetic quantum yield (ΦPSII) and CO2 fixation rates (C) and non-protein thiols content (D) in controls and plants stressed with 300 mM NaCl. The first analysis was carried out 3 h after reaching a concentration of 300 mM NaCl. Data are means ±SD of n=5 experiments with six measurements each for H2O2 and three for MDA and non-protein thiols. The significant difference marked by different letters was calculated using Student’s t-test and further analyzed with Fisher LSD test, with P<0.05, using InfoStat statistical software. Along the x-axis: C, control; S, salinity.

