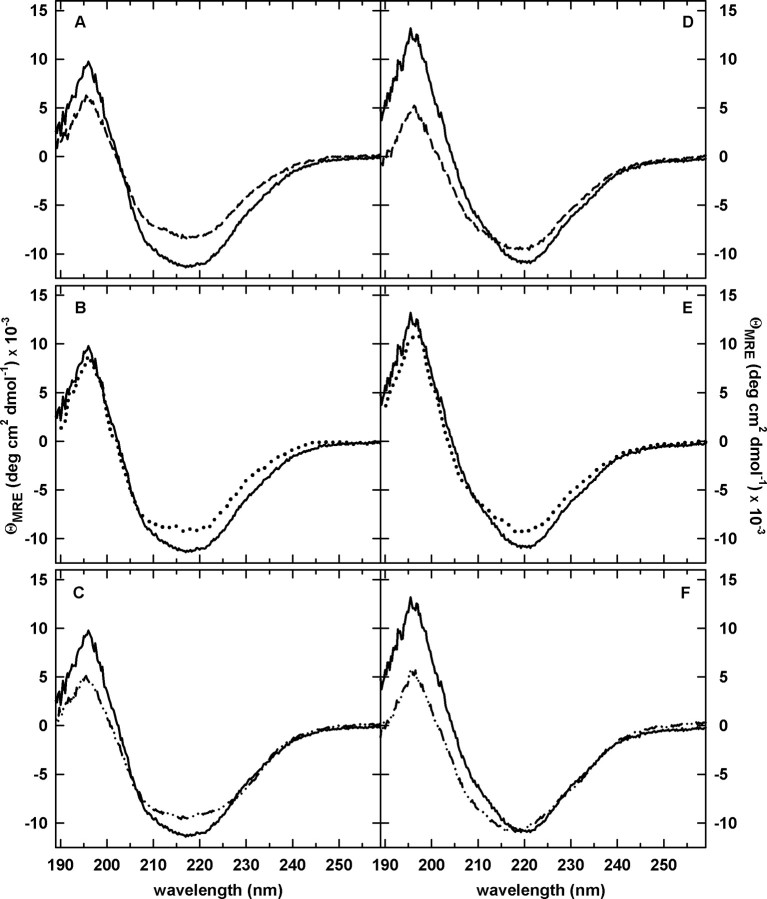
Fig. 2.
Far-UV CD spectra of WT-DHFR and the circular permutants in the absence (A–C) and presence (D–F) of excess methotrexate. The spectrum for WT-DHFR is shown by a solid line in A–F. (A,D) cpN18 (dashed lines); (B,E) cpP39 (dotted lines); (C,F) cpD69 (dashed dotted lines). The final concentrations were 5 μM for protein and 25 μM for MTX (D–F only). Buffer conditions are 10 mM potassium phosphate, pH 7.8, 0.2 mM K2EDTA and 1 mM β-mercaptoethanol at 15°C.

