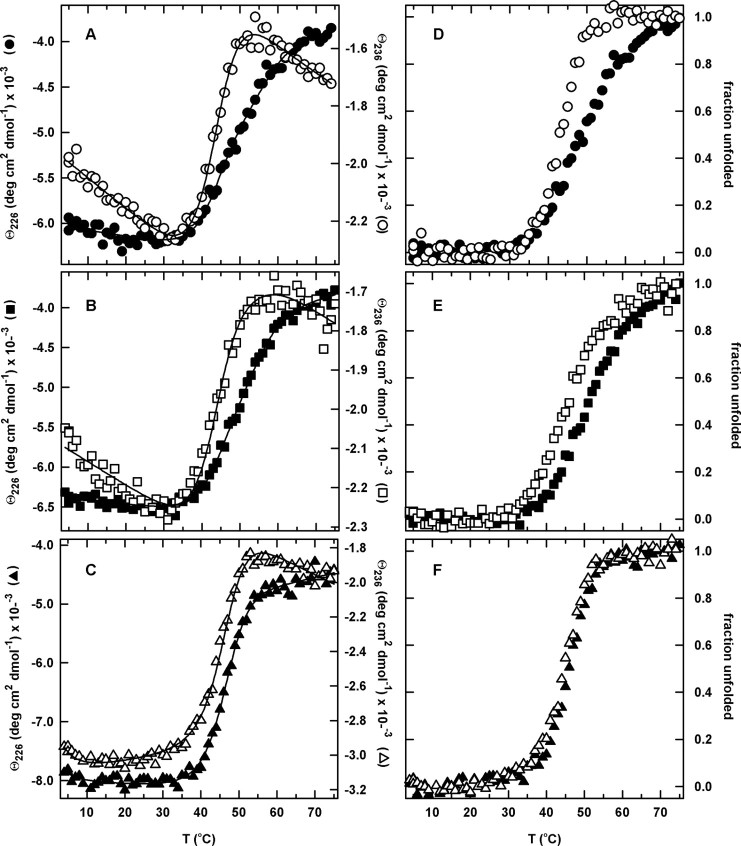
Fig. 4.
The temperature-induced equilibrium unfolding transitions (A–C) and the corresponding normalized unfolding curves (D–F) for the circular permutants monitored by far-UV CD at 226 and 236 nm. (A,D) cpN18, 226 nm (closed circle) and 236 nm (open circle), (B,E) cpP39, 226 nm (closed square) and 236 nm (open square), and (C,F) cpD69, 226 nm (closed triangle) and 236 nm (open triangle). The normalized unfolding curves were generated as described in the legend to Figure 3, and the continuous lines represent the global fits to a two-state (cpD69) and three-state (cpN18 and cpP39) equilibrium model. The protein concentration was 5 μM. Buffer conditions are described in the legend to Figure 2.

