
Fig. 5.
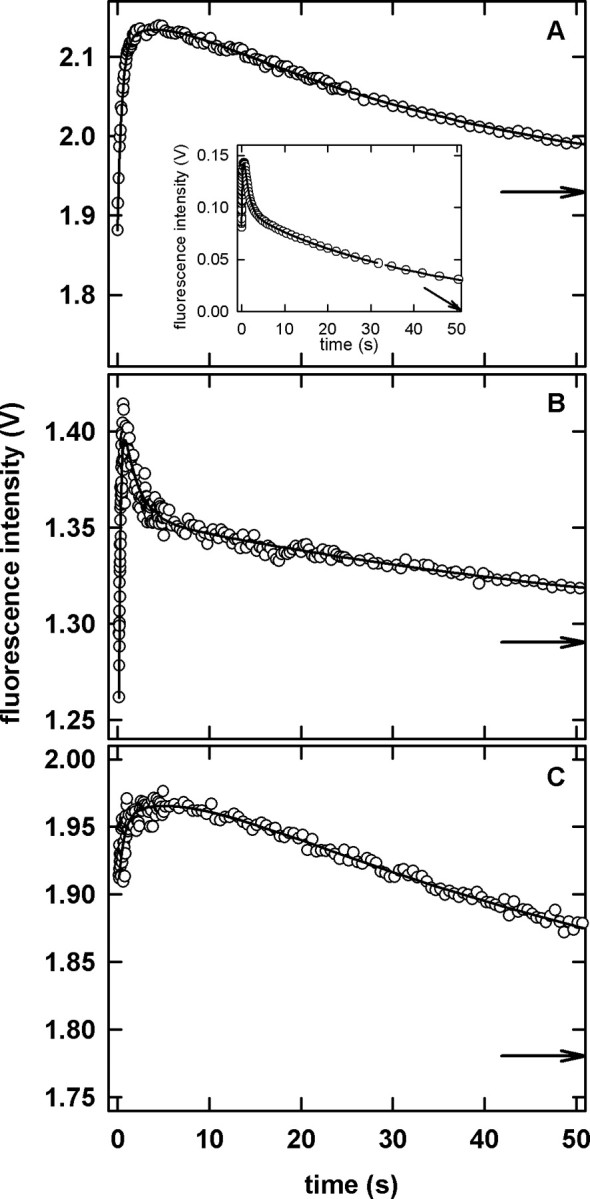
Stopped-flow fluorescence kinetic measurements for the refolding reaction of the circular permutants. (A) cpN18, (B) cpP39 and (C) cpD69. The inset in panel A illustrates the refolding reaction of WT-DHFR. The continuous lines represent the fit of the data to three (circular permutants) and five (WT-DHFR) exponentials. The arrows indicate the final fluorescence intensity. Although data were collected for 500 s, only the first 50 s are shown to better illustrate the presence of the hyperfluorescent intermediate. The final protein concentrations was 1–3 μM. Buffer conditions are described in the legend to Figure 2.