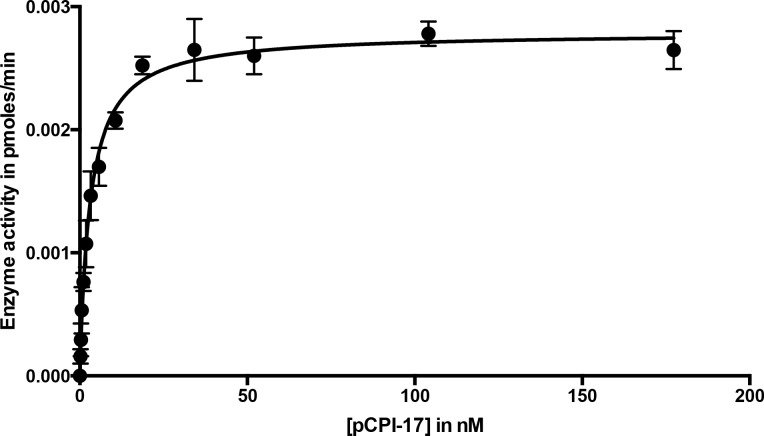
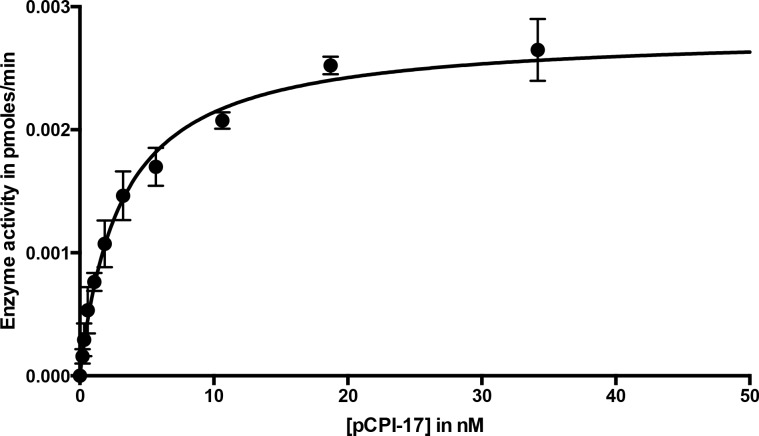
Figure 3. Dephosphorylation of pCPI-17 by MLCP as a function of pCPI-17 concentration.
All assays contained 0.1 nM MLCP and were performed for 3 min at 30°C in a total volume of 8 μL. The experiment was replicated in triplicate (n = 3); error bars represent standard deviations. Data were analyzed by non-linear regression to Michaelis-Menten kinetics with Prism 6 software (GraphPad Software, Inc., La Jolla, CA). For this experiment, Km = 3.03 ± 0.22 nM; kcat = 0.059 ± 0.002 s−1.


