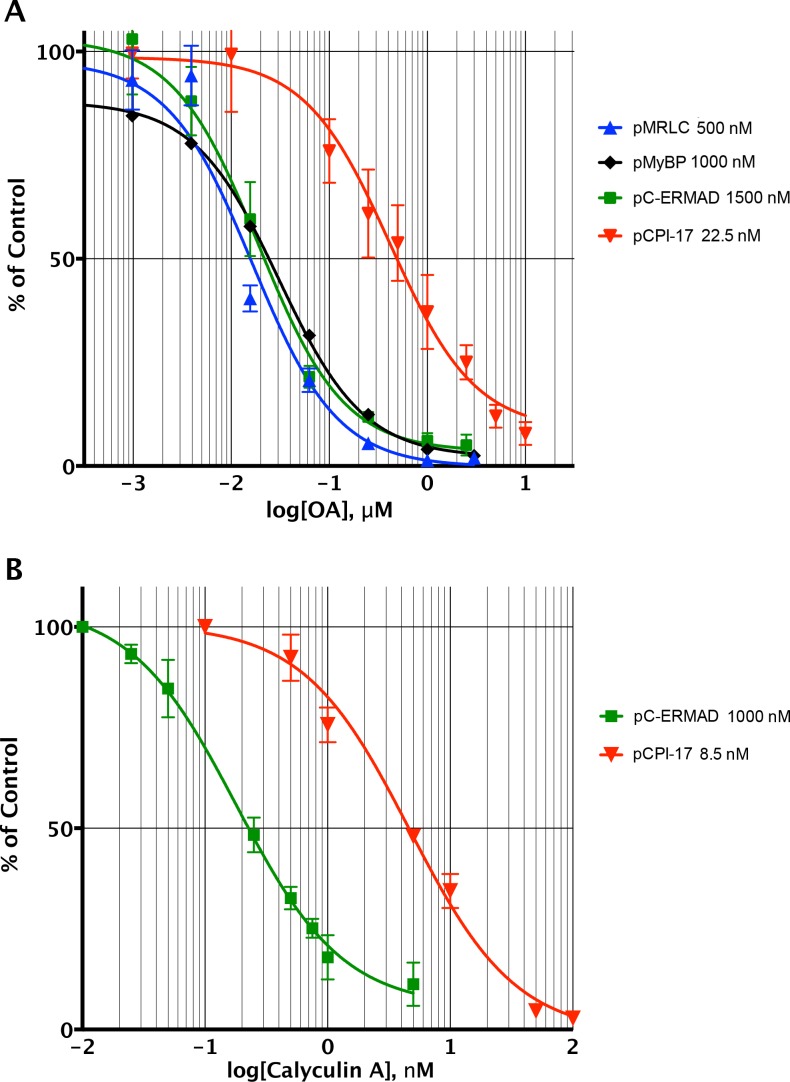
Figure 4. Determining the pCPI-17/MLCP Km by competitive inhibition.
(A) Inhibition of MLCP by okadaic acid (OA). Enzyme assays in the presence of increasing levels of OA were performed with the indicated substrates at the indicated concentrations; in all assays, the concentration of MLCP was 0.1 nM. Values are presented as a percentage of the average of four control reactions for each substrate without OA. For pCPI-17, each point represents the average, and error bars the standard deviation, of five trials (n = 5); for phosphorylated myosin regulatory light chain (pMRLC), n = 4; for pC-ERMAD, n = 2; for pMyelin Basic Protein (pMyBP), n = 1. Because the MLCP concentration is very low, the IC50s of the pMRLC, pMyBP, and pC-ERMAD reactions must be close to the Ki for OA, which is therefore ~20 nM. The ~10–20× larger IC50 with pCPI-17 indicates that this substrate can compete effectively with OA because its Km is smaller than the Ki. Indeed, the best-fit Km determined by nonlinear regression of this and a similar experiment using 8.75 nM pCPI-17 (n = 3; not shown) is 0.59 ± 0.05 nM (see Supplementary file 1). (B) Inhibition of MLCP by calyculin A. Enzyme assays in the presence of increasing levels of calyculin A were performed with pCPI-17 or with pC-ERMAD at the concentrations indicated; the concentration of MLCP was 0.1 nM. Values are presented as a percentage of the average of three control reactions for each substrate without OA; three replicates of each data point were assayed (n = 3), and error bars represent the standard deviations. The measured Ki of calyculin A for MLCP (from the dephosphorylation of pC-ERMAD) was 0.17 ± 0.05 nM. As with the OA experiments in part (A), the increased IC50 with pCPI-17 (~30×) reflects competition of this substrate with calyculin; the nonlinear regression best-fit is Km = 0.36 ± 0.10 nM for the pCPI-17 dephosphorylation reaction.

