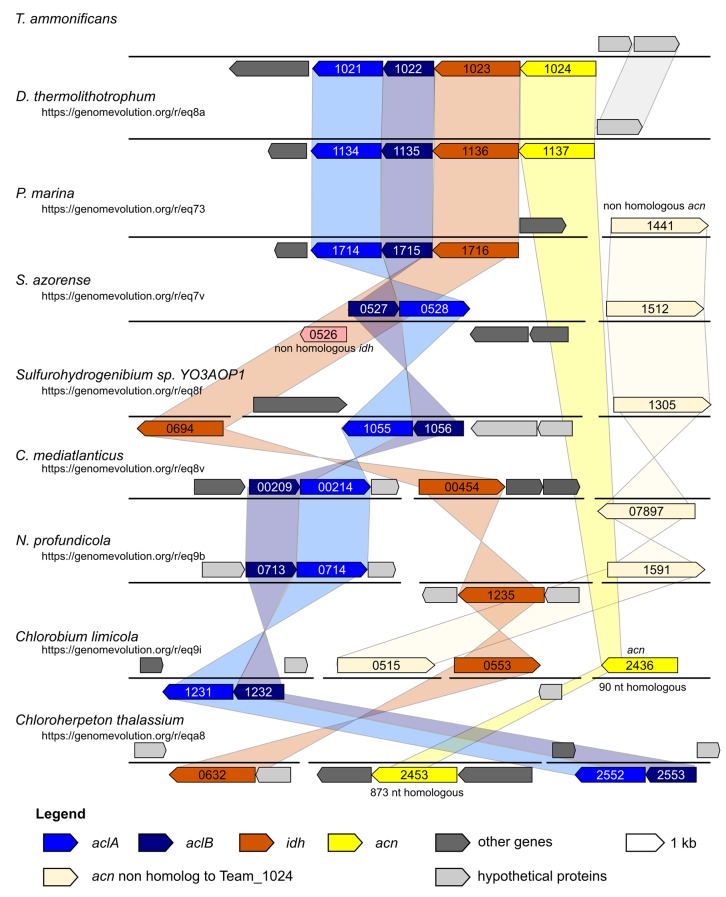
Figure 8. Syntheny diagram presenting the genome organization around the rTCA key enzyme ATP citrate lyase.
In T. ammonificans the two subunits of the ATP citrate lyase enzyme are organized in a single operon together with the isocitrate dehydrogenase and the aconitate dehydratase. The numbers inside each gene represent the locus number for the organism. Shaded color connects synthenic regions. The website address below each organism name is a permanent link to the pairwise analysis performed on the Genome Evolution server (http://genomevolution.org/) against T. ammonificans.

