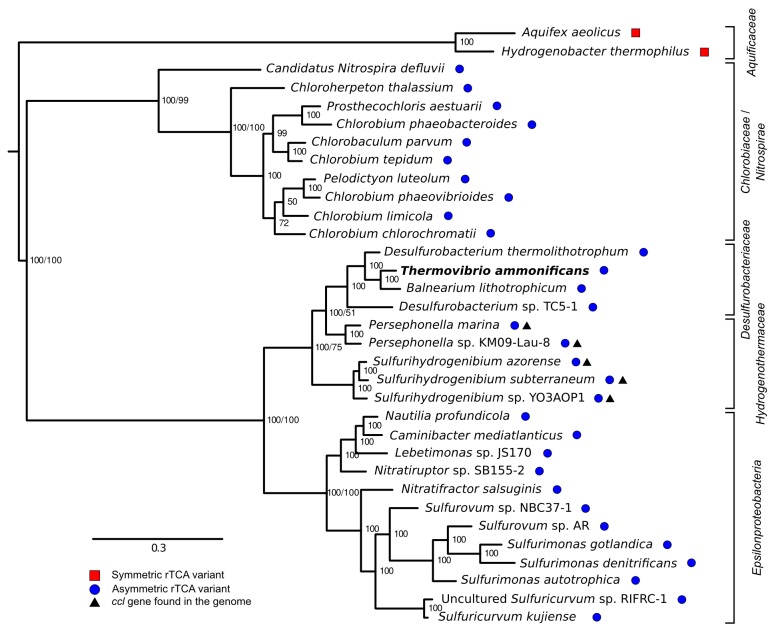
Figure 9. Phylogenetic tree of ATP citrate lyase amino acid sequences.
The tree was constructed with Bayesian inference and maximum likelihood methods and presents the phylogenetic relationship among the concatenated subunit of the ATP citrate lyase in different organisms known to use the rTCA cycle. The numbers near the nodes represent the bayesian posterior probability (left number) and the maximum-likelihood confidence values based on 1000 bootstrap replications (right number). Bar, 30% estimated substitutions. Accession numbers are reported in Figure 9—source data 1. Squares – symmetric rTCA cycle variant characterized by the presence of two-step enzyme reactions for the cleavage of citrate and the carboxylation of 2-oxoglutarate. Circles – asymmetric rTCA cycle variant characterized by one-step reaction enzymes catalyzing the above reactions. Triangles – presence of a citryl-CoA lyase in the genome. See Supplementary Materials for details.
DOI: http://dx.doi.org/10.7554/eLife.18990.018

