Figure 1. E. coli evolves faster migration through a porous environment in rich and minimal media.
(a) A schematic of the selection procedure. E. coli are inoculated into the center of a low viscosity (0.3 % w/v) agar plate where they form an expanding colony driven by metabolism and motility. After a fixed period of incubation, samples are taken from eight locations around the outer edge of the expanded colony, mixed, and used to inoculate a fresh plate. (b) Shows expanded colonies in rich medium (LB) plates after 12 hr of incubation over five successive rounds of selection. The color bar to the right applies to all panels in (b), with darker gray indicating higher cell density. Image intensity is assumed to be monotonic but not linear with cell density in the plate. Scale bar in the left panel is 1 cm and applies to all panels in (b). (c) Shows the rate of migration as a function of round of selection over 15 rounds for five replicate selection experiments in rich medium. No rate is reported for replicate 1 round 8 due to failure of the imaging device. Errors in measured rates of migration are smaller than the size of the markers. (d) Shows colonies (gray regions) in minimal medium (M63, 0.18 mM galactose) after 48 hr of incubation. The color bar to the right applies to all panels in (d). The scale bar in the left panel is 1 cm. (e) Shows the rate of migration as a function of round of selection over 10 rounds for five replicate selection experiments in minimal medium. Errors in migration rates were smaller than the size of markers. See Materials and methods for details of image processing in both experiments.
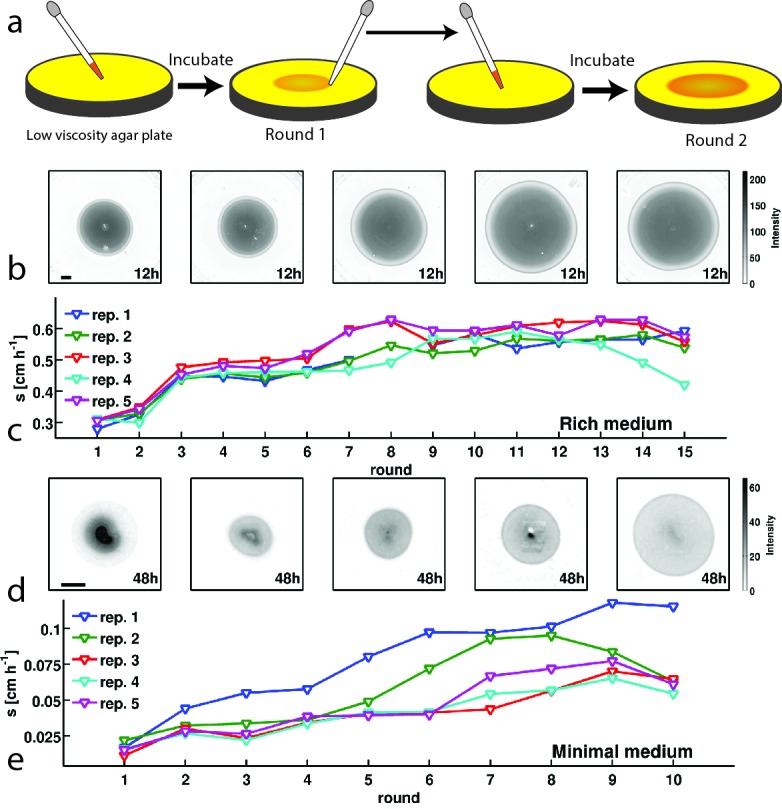
Figure 1—figure supplement 1. Selection with non-chemotactic (cheA-Z) mutant.
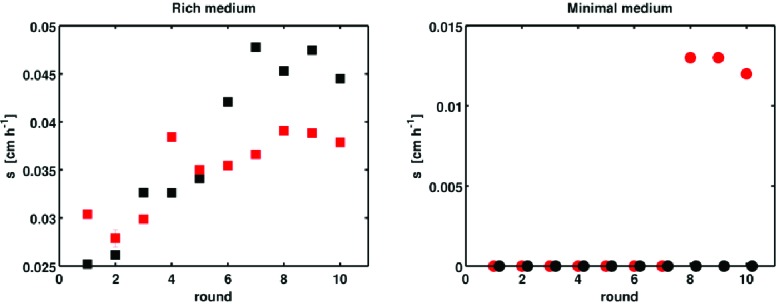
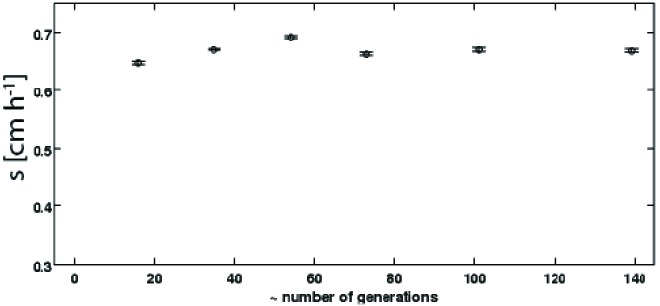
Figure 1—figure supplement 2. Change in migration rate during long-term liquid culture.
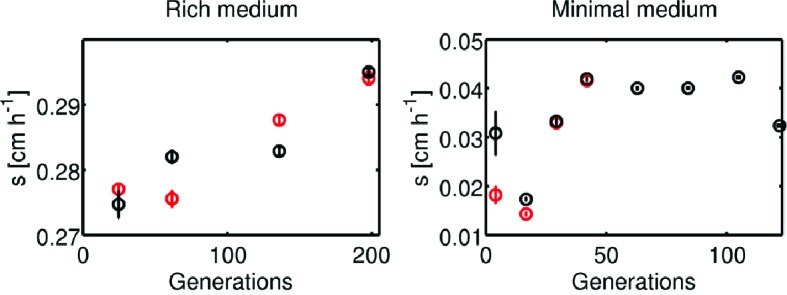
Figure 1—figure supplement 3. Adaptation in rich medium depends on sampling location.
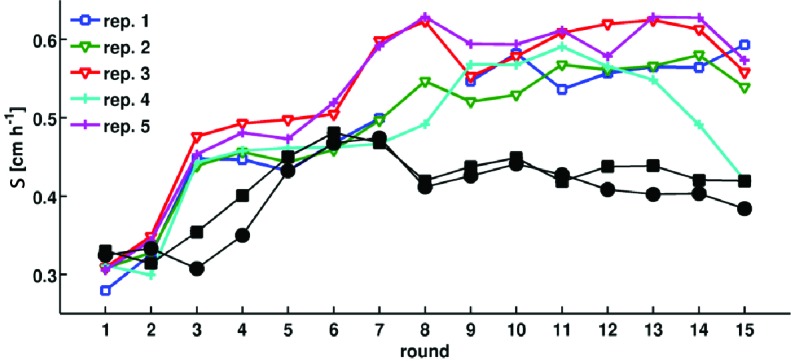
Figure 1—figure supplement 4. Comparison of founding and evolved strains to RP437.
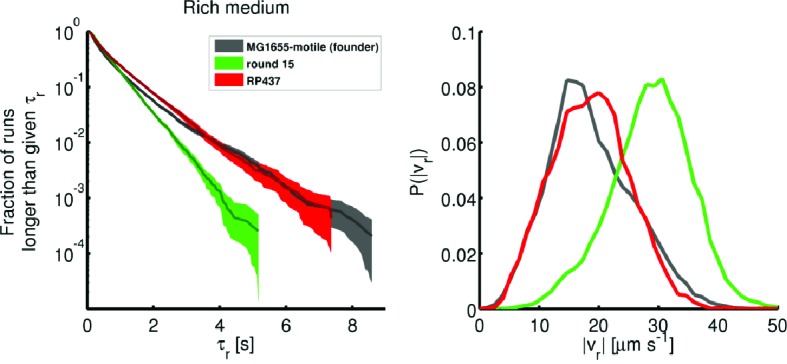
Figure 1—figure supplement 5. Persistence of rich medium fast migrating phenotype in liquid culture.