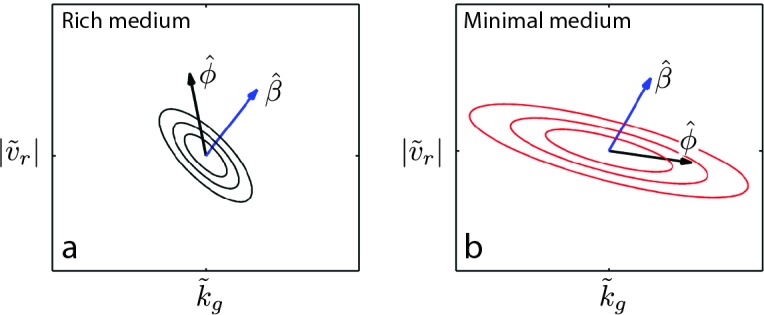
Figure 6. Evolution of correlated traits.
The evolutionary model describes the change in phenotype relative to the founder () under selection described by . Panels show unit vectors in the direction of observed phenotypic evolution () and the direction of selection inferred from the reaction-diffusion model (). Ellipses show quartiles for a normal distribution of phenotypes with covariance matrix that is consistent with and . In both panels, we set the correlation coefficient between and is but our conclusions hold for . In rich medium (a) and in minimal medium . In rich medium and in minimal medium .

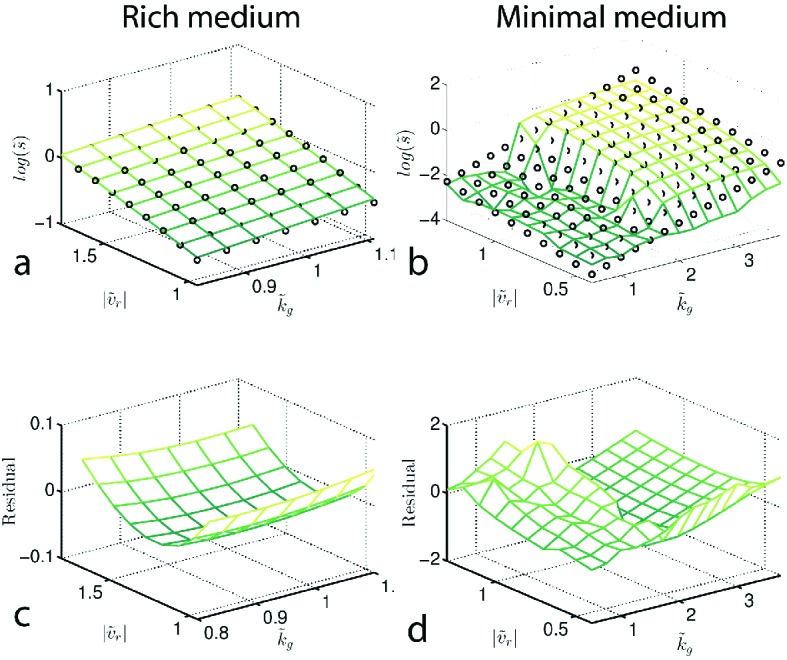
Figure 6—figure supplement 1. Determining from reaction-diffusion model.

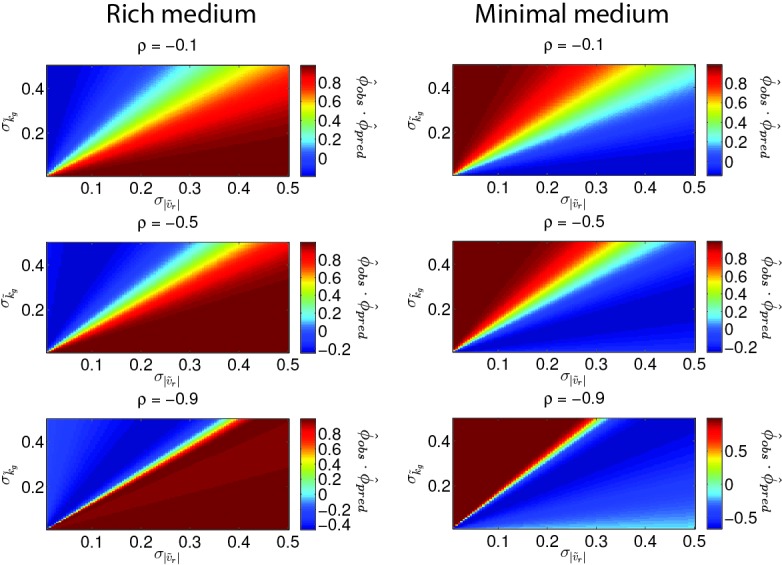
Figure 6—figure supplement 2. Direction of phenotypic evolution with and .

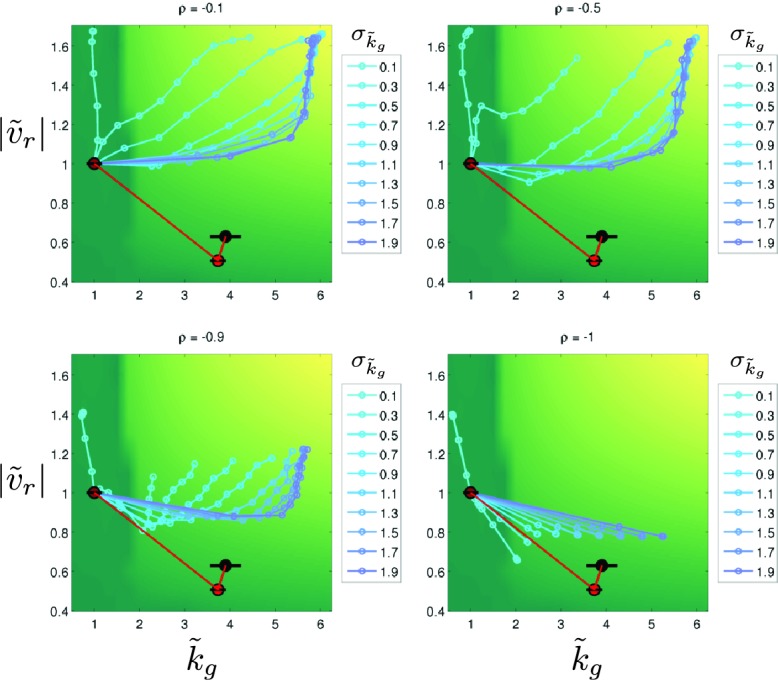
Figure 6—figure supplement 3. Stochastic simulations of selection in minimal medium.

