
FIG. 2.
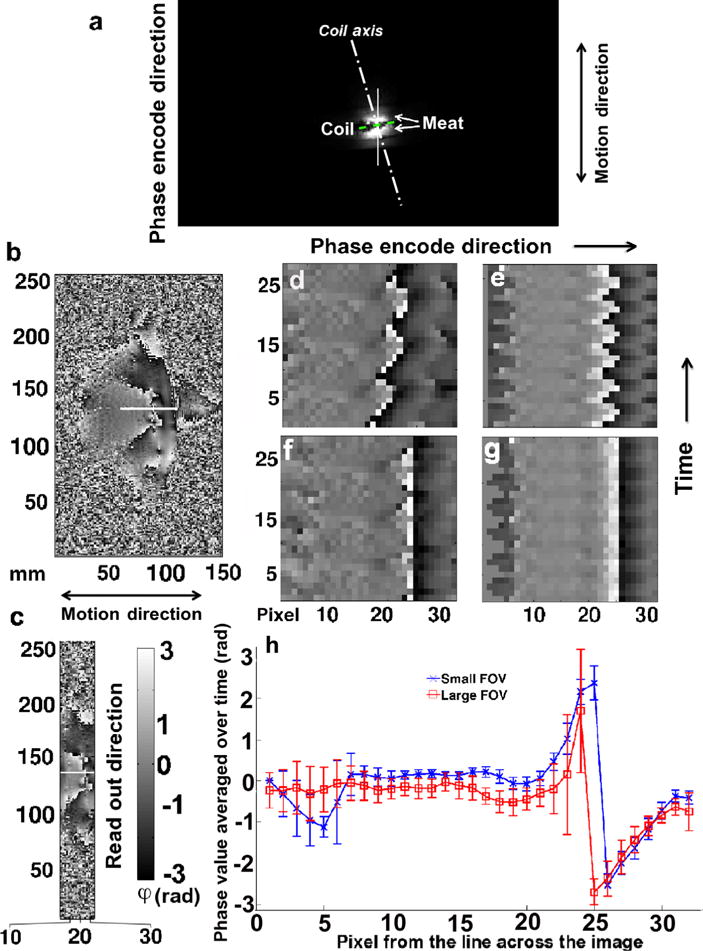
Moving phantom image analysis. Images acquired with the local coil. a: Large FOV magnitude image indicating the experiment setup with the coil (dashed line) positioned in between two pieces of meat (bright signal); phase image over the large (b) and limited (c) FOV at time point t = 15 without gating; (d) and (e) display the phase signal of the same phase encode step (row) over consecutive time frames (column), acquired across the white line in (a), (b), and (c), respectively; (f) and (g) display the same phase signal as in (d) and (e), respectively, but after a manual correction was applied to compensate for the imperfection of the moving phantom; and h: phase values averaged over time along the white solid lines for both the large and the limited FOV and their corresponding standard deviation. The sharp change in phase signal value around pixel 25 is due to the interface of the two pieces of meat. [Color figure can be viewed in the online issue, which is available at wileyonlinelibrary.com.]